A Competition of Competence

Many analysts are claiming that the U.S. and China are in a competition. Some call it a “strategic competition.” We prefer to describe it as a “competition of competence.” But in all of this talk of competition, no one seems to be keeping track of who is winning the competition in a systematic, easy to find, comprehensive way. This page is an attempt at beginning to do so.

We break data into five large categories: a) Economy; b) Environment; c) Social; d) State Capacity; and e) Demographics. We might add “military” in the future but are still grappling with what measures to include in such a category.

This, we should stress, is a beginning. We anticipate we will include additional measurements and it’s possible we might add categories. If there is data you think we should add or concerns you have about the current data, please let us know. We will regularly update the data. In the meantime, enjoy examining how the competition is going.

Economy

There are many categories in which to measure China and the U.S. but the economy is likely the most important one. After all, China’s rise is tied to its remarkable economic success of the last 40 years. Its large market provides China great geopolitical leverage. We argue in our book, Challenging China, that China won’t have high GDP growth rates in the future. How China fares as it enters a new economic era and how the U.S. tackles its own economic challenges will go a long way towards determining who wins the competition. The economic competition between China and the U.S. (and the E.U., Japan and other countries) will drive competition in the other categories.

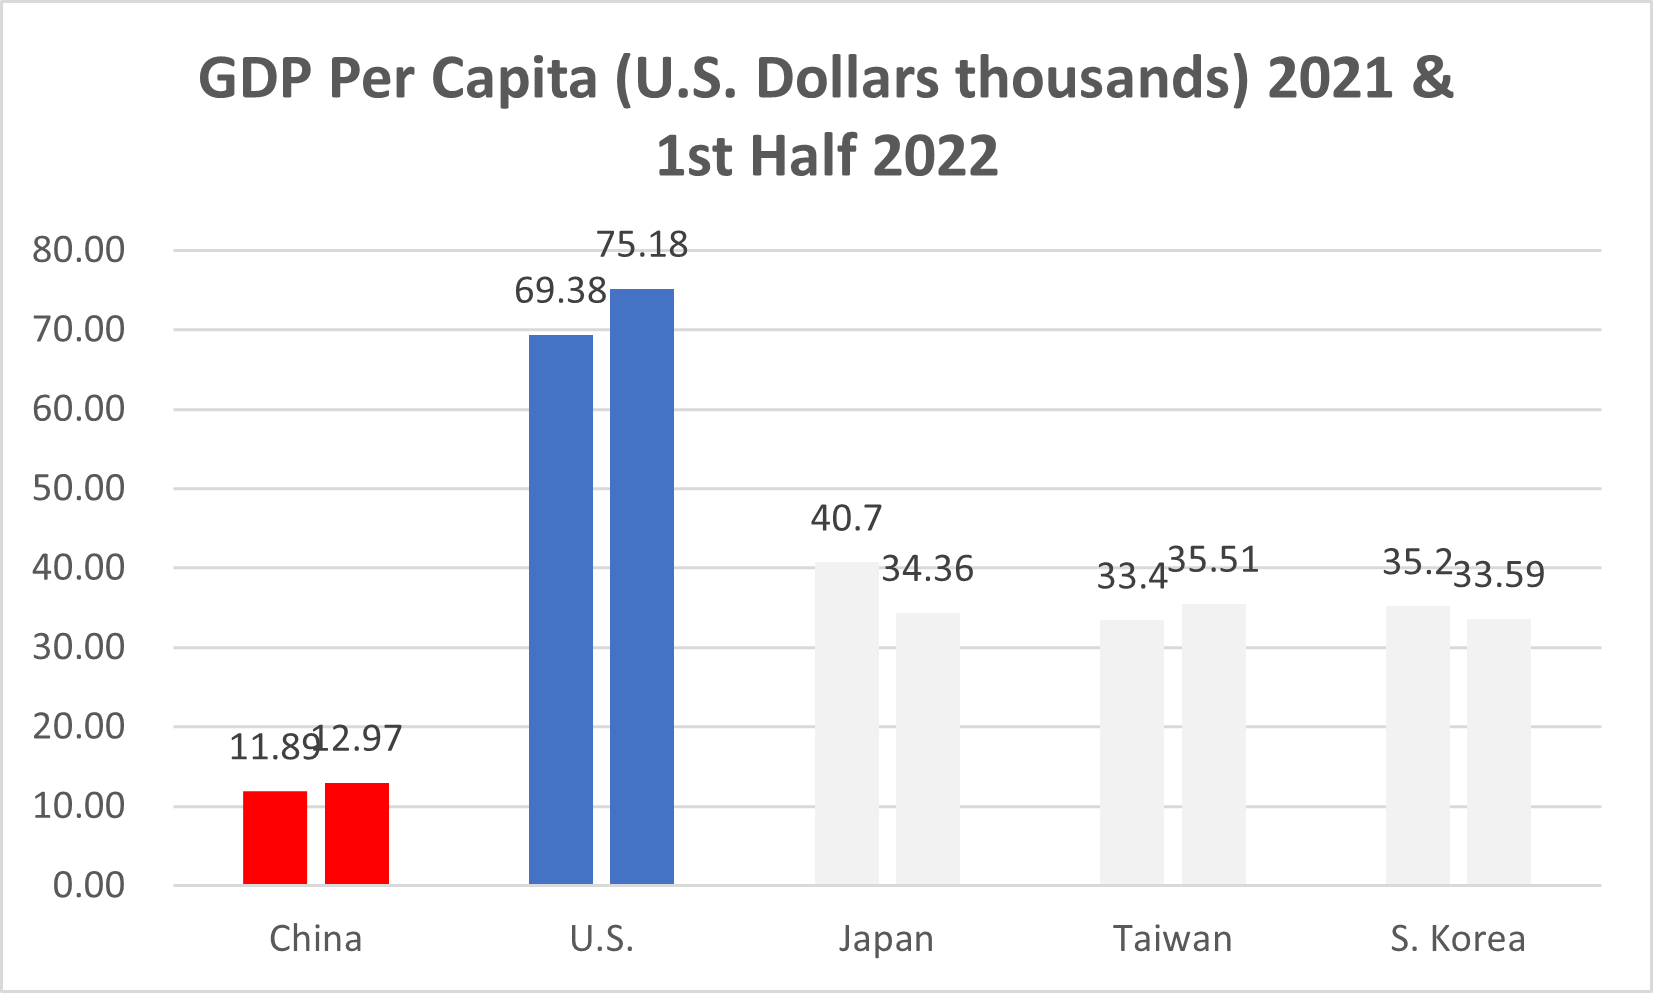
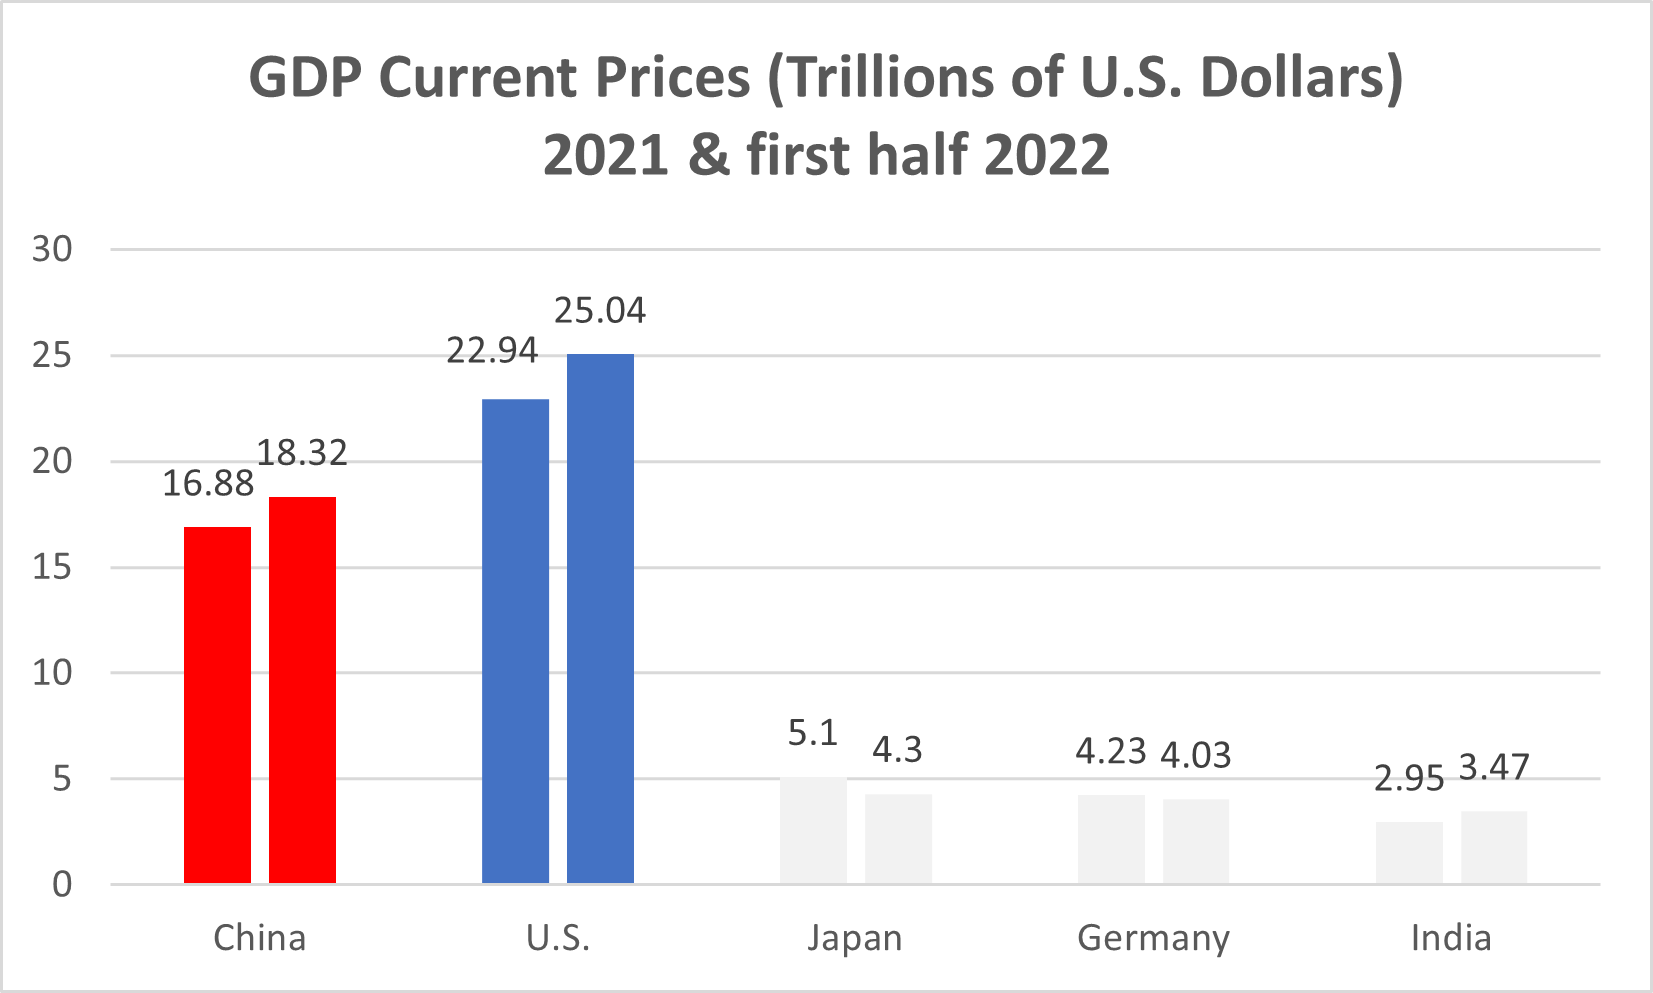
China has the second-largest economy in the world behind only the United States in terms of nominal GDP (GDP measured in current prices). Remember that GDP is the value of all goods and services. Note China lies about its GDP growth so take these numbers with a grain of salt.  Source: IMF  Will update every six months

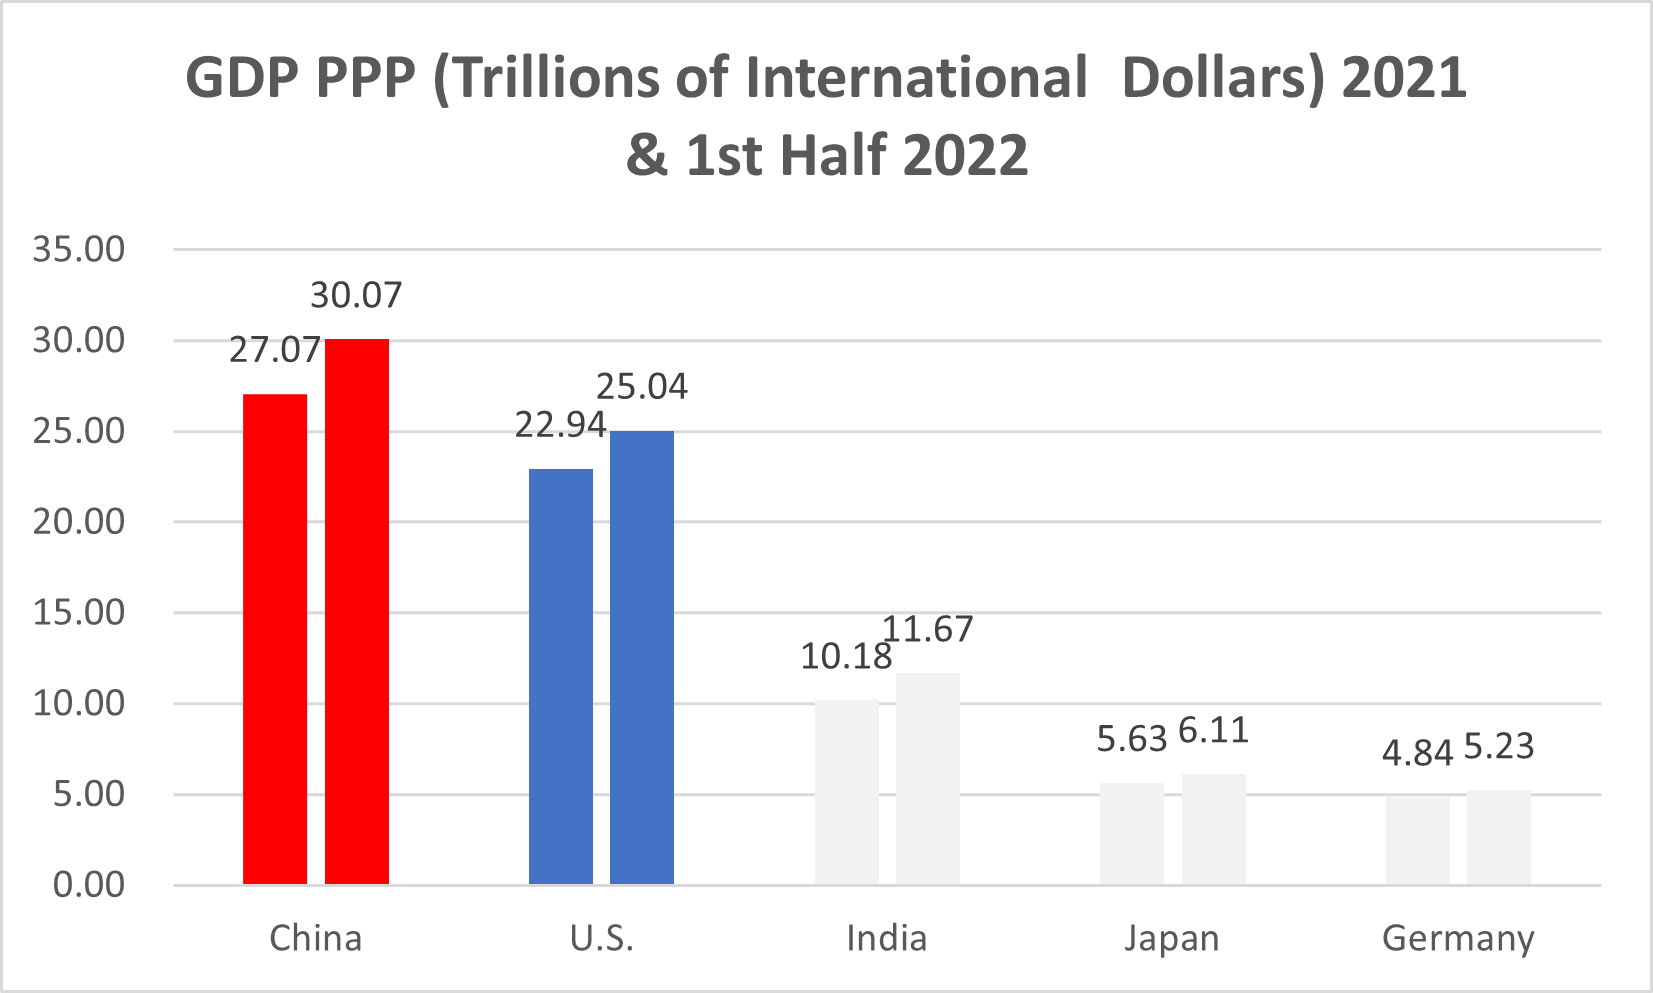
China has the largest economy in the world, even larger than the U.S., when measuring by purchasing power parity (PPP) which most economists note is the best way to compare countries’ economies. PPP takes into account different costs of living across countries. Source: IMF   Will update every six months

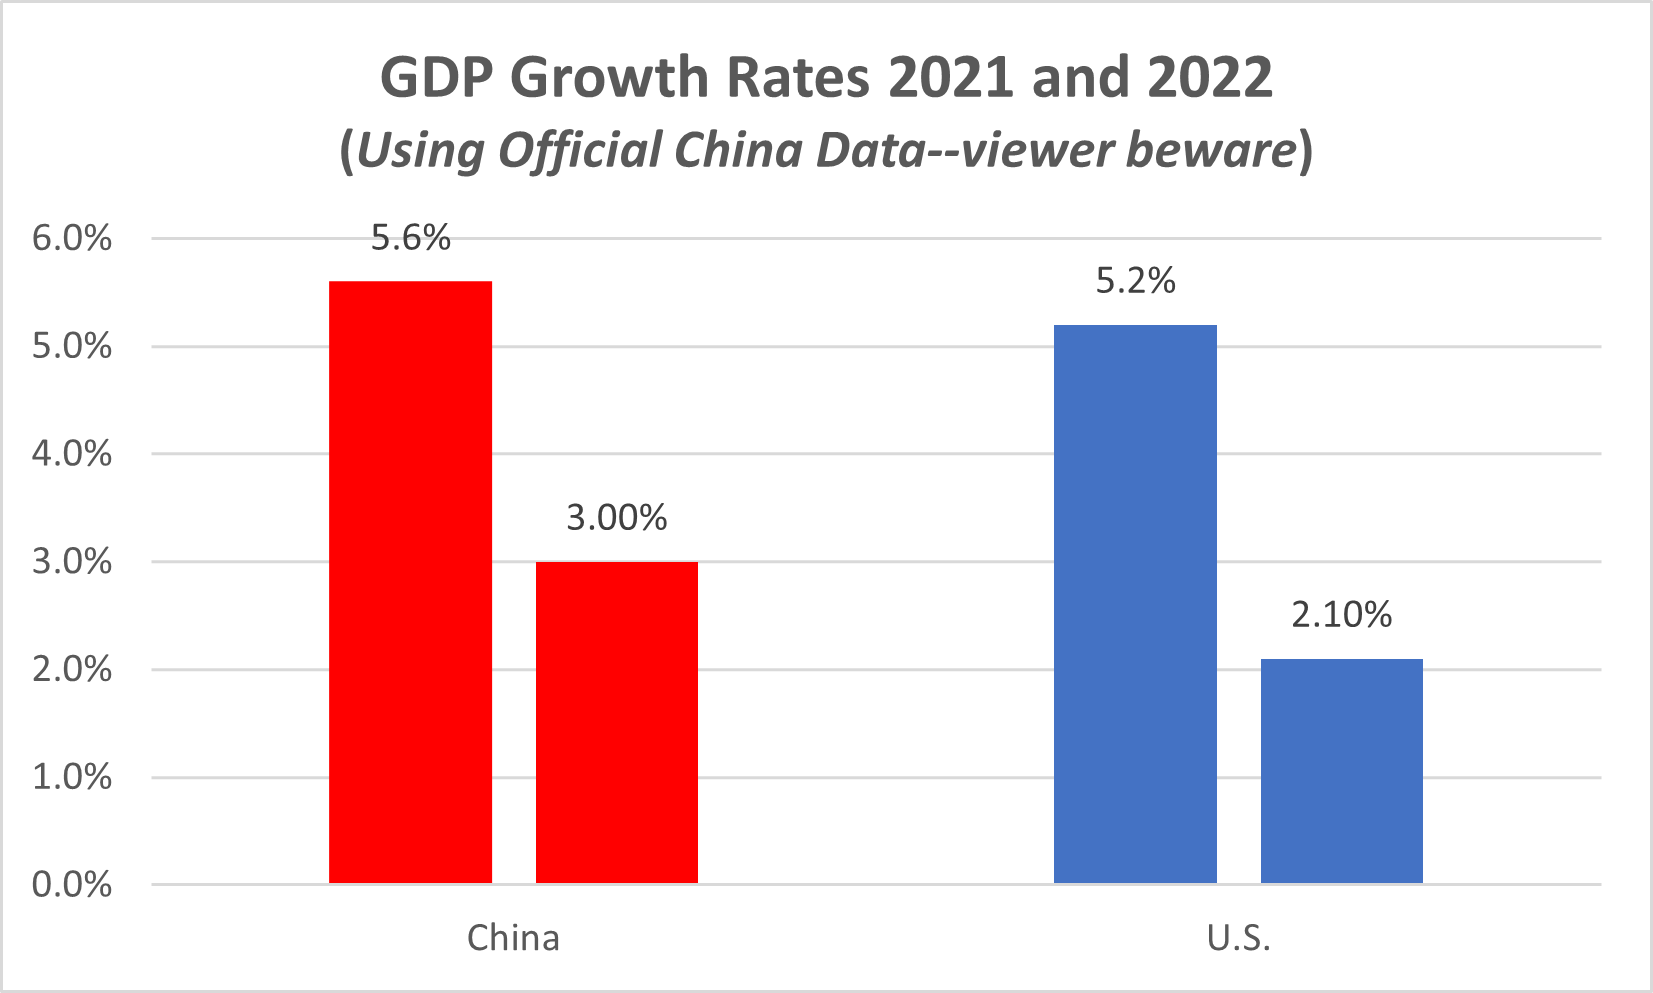
China almost definitely did not grow 3% in 2022. China Beige Book estimates China’s GDP growth was between 1 and 2 percent. Like our annual spring training predictions for the Seattle Mariners, China’s measurement of GDP growth is not overly accurate. China has been credibly accused of overstating its GDP growth so take this data with a large grain of GDP salt. Source: IMF   Will update quarterly

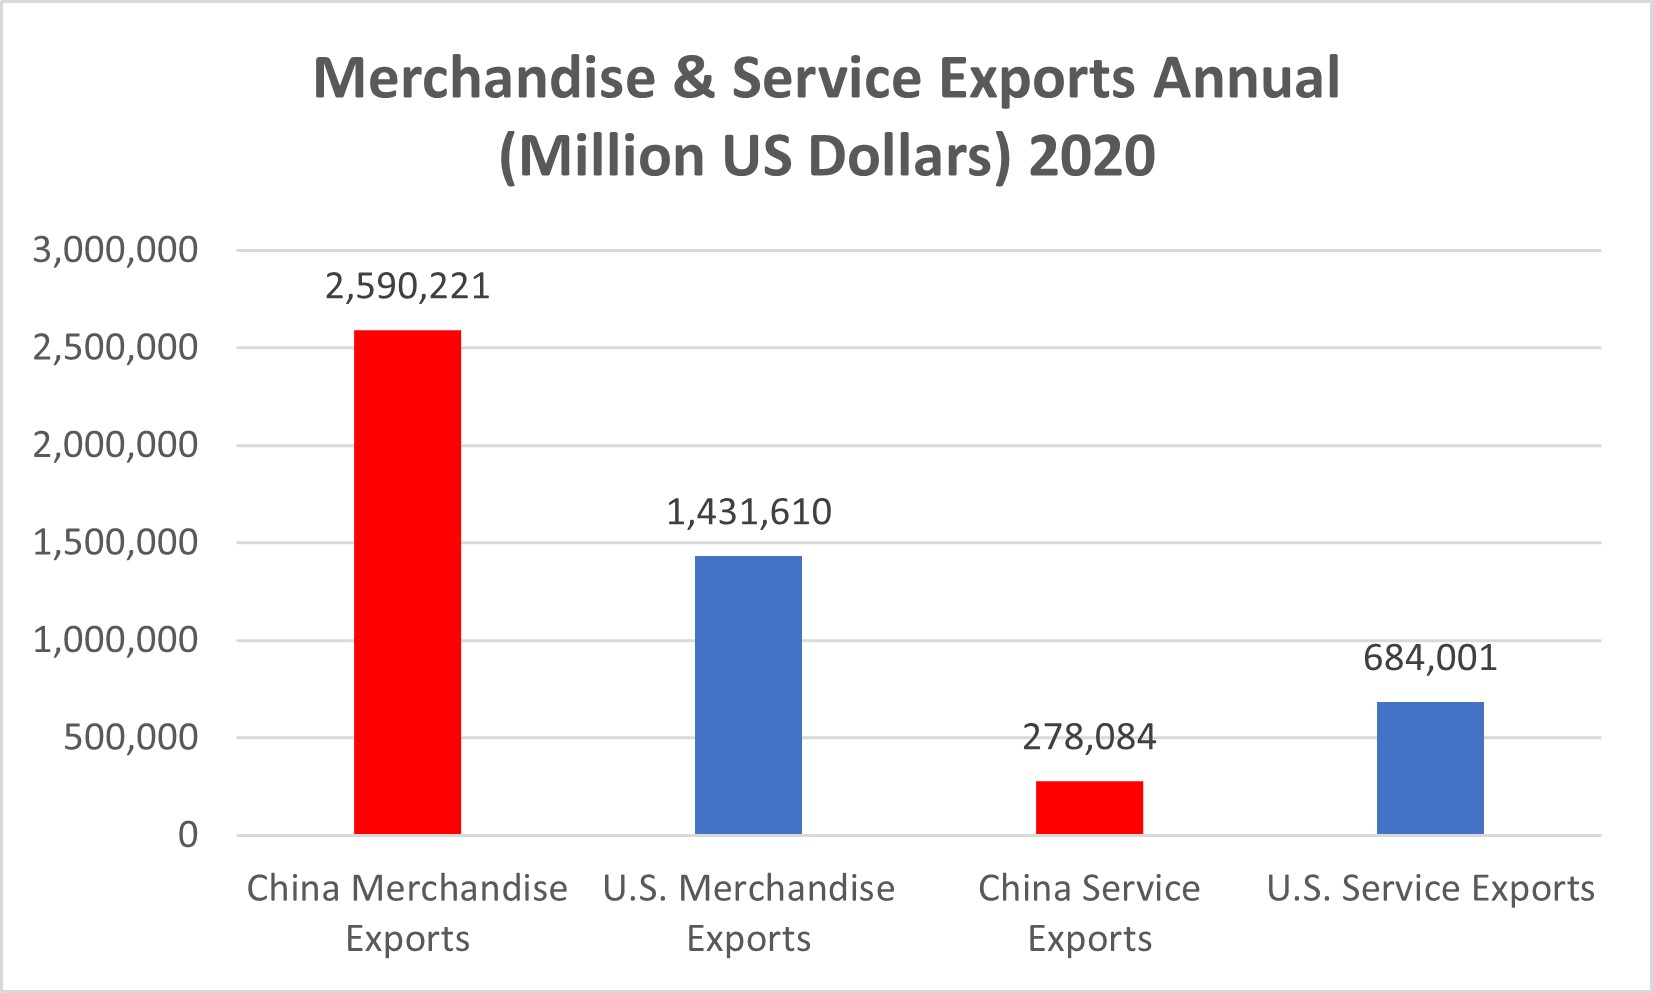
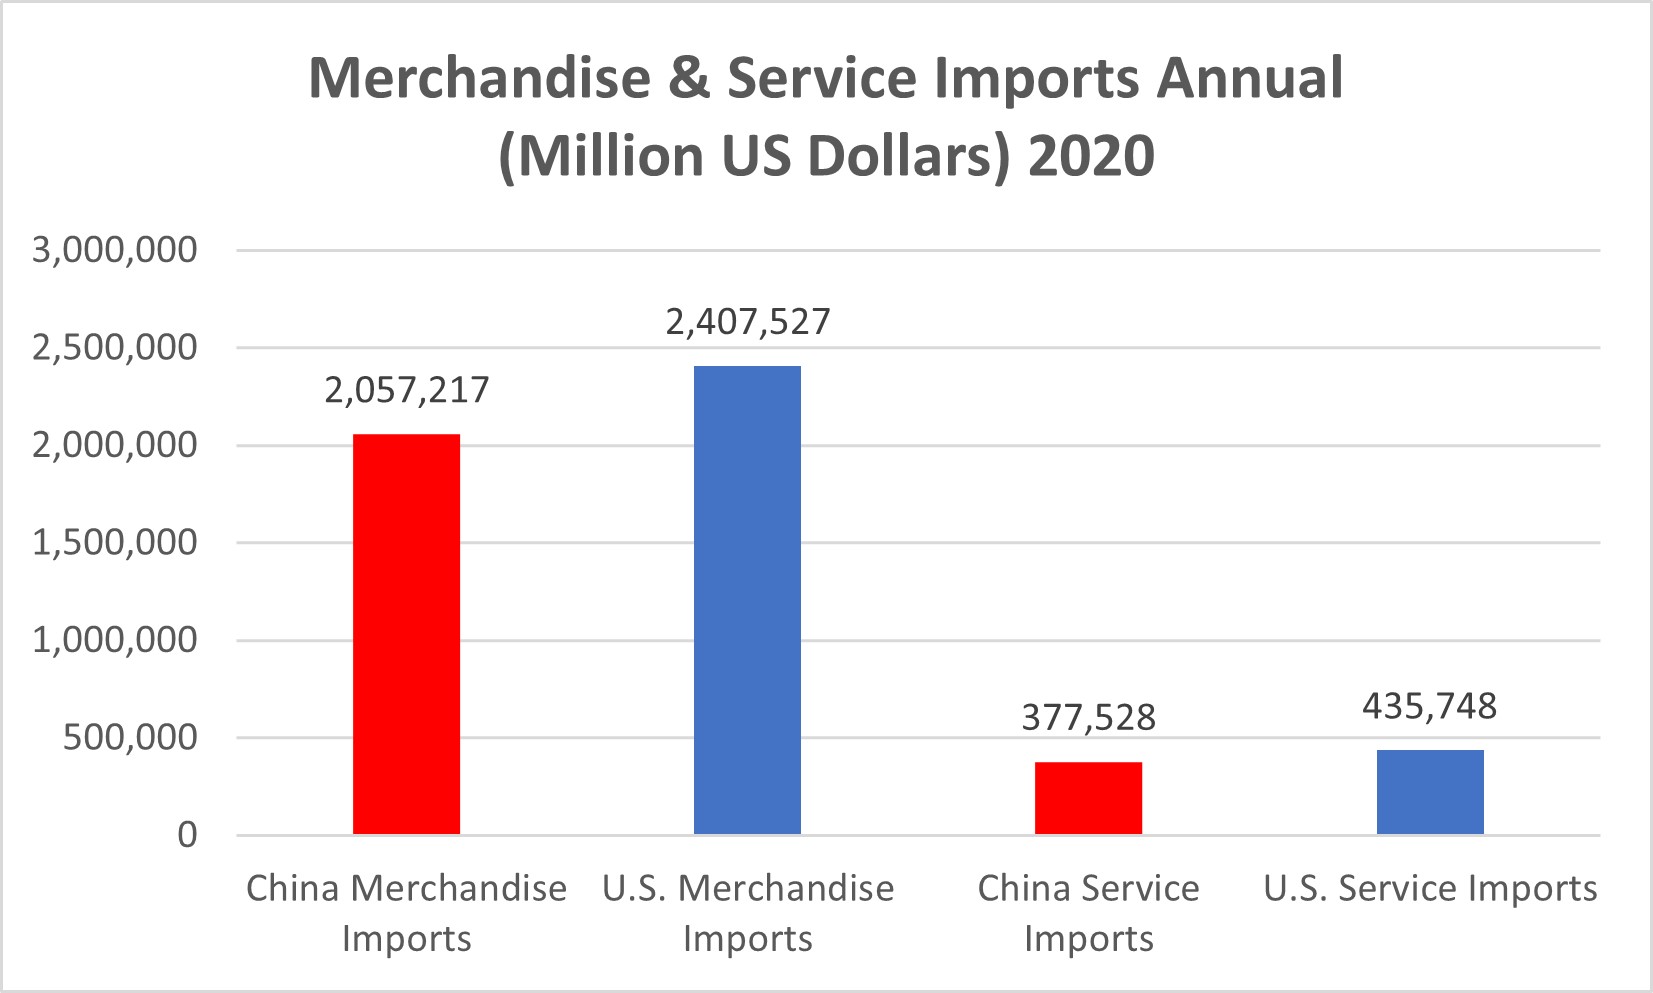
China is a much larger exporter of merchandise (things you can touch and feel like toys, solar panels and electronics). The U.S. is a larger exporter of services (software, engineering and students, e.g.) although at a much lower volume. China is the largest trading partner with far more countries than the United States is, giving it geopolitical leverage and influence. Source: WTO  Will update quarterly

China has been increasing exports during the pandemic but decreasing imports. Source: WTO  Will update quarterly

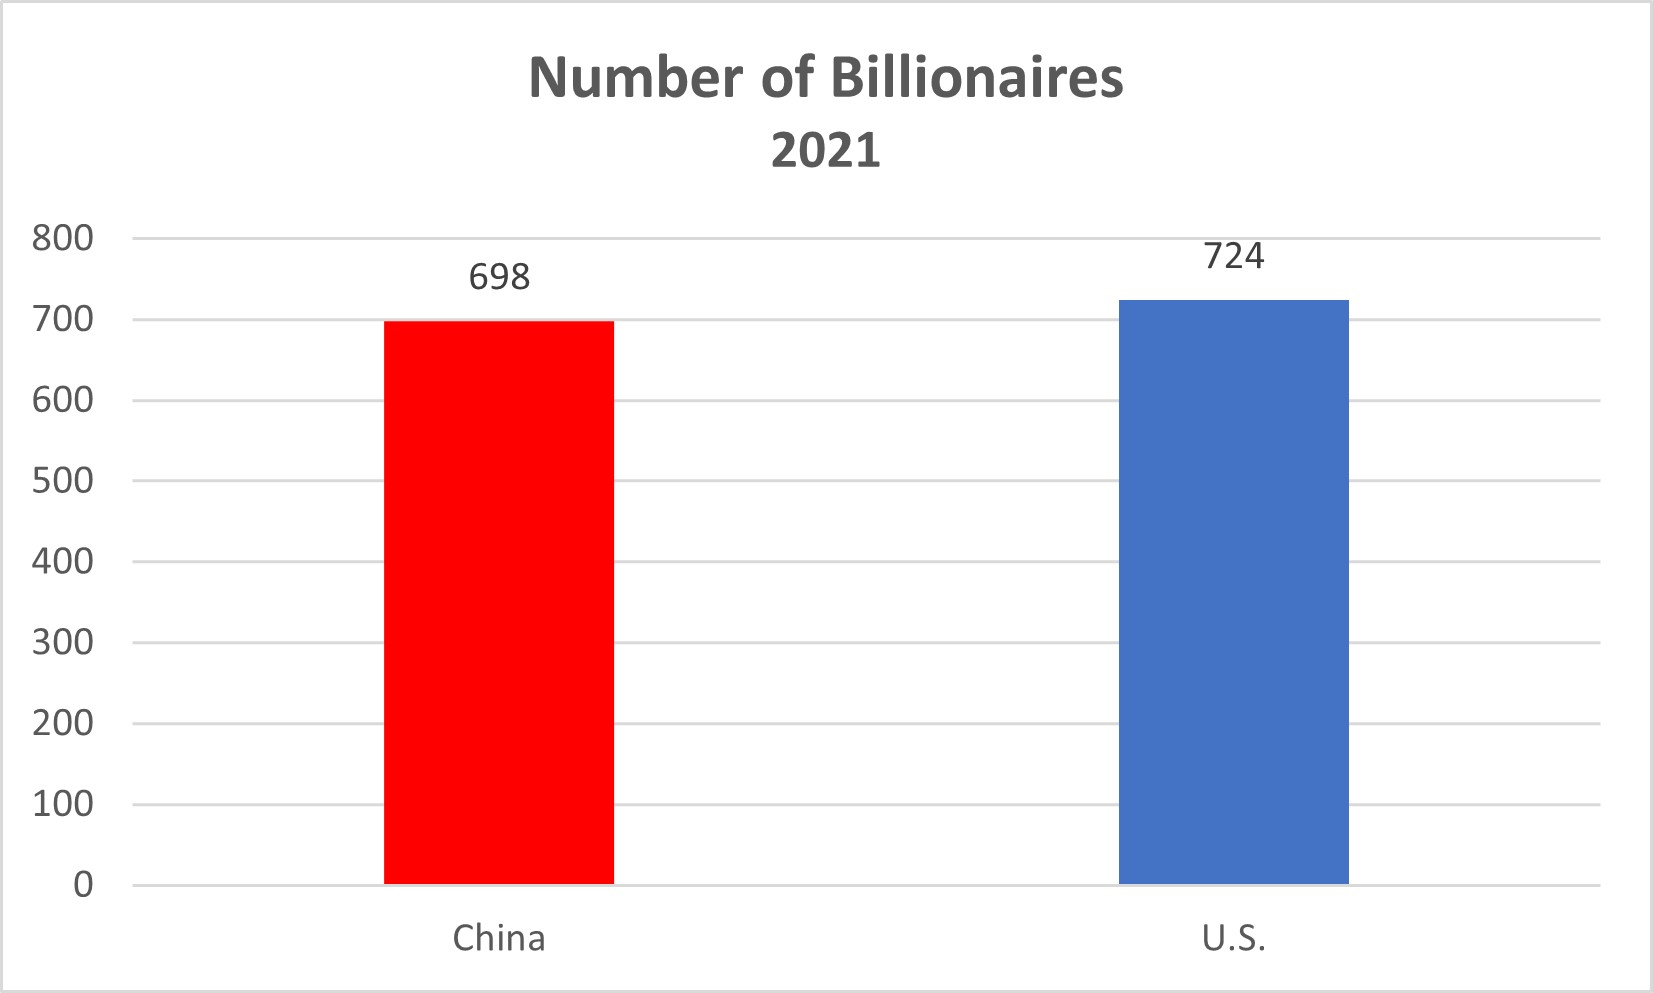
China was quickly catching up in total number of billionaires but will China’s crackdown on consumer tech companies and an emphasis on “common prosperity” slow its growth in billionaires? What will that mean for its economy overall? Source: Forbes via Wikipedia Will update annually

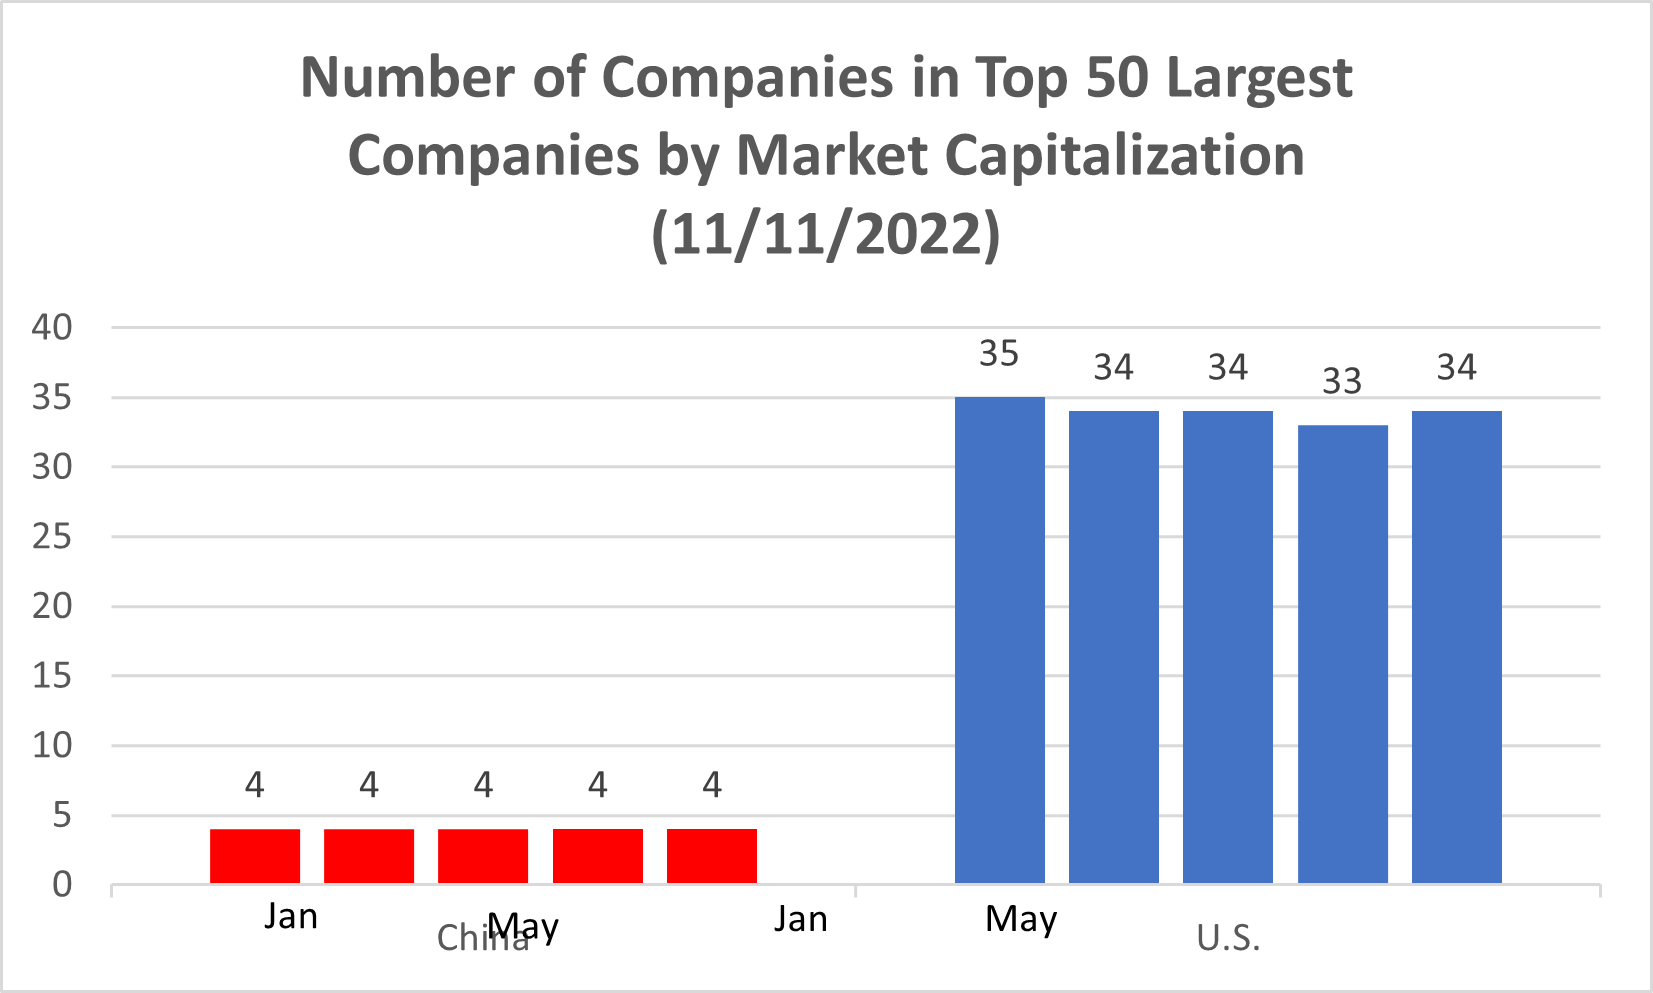
Over the last year, with the crackdown on large consumer tech companies, China has fewer of the largest companies by market capitalization than it did. The U.S. continues to dominate in this area.  Source: Market Cap Companies Will update monthly

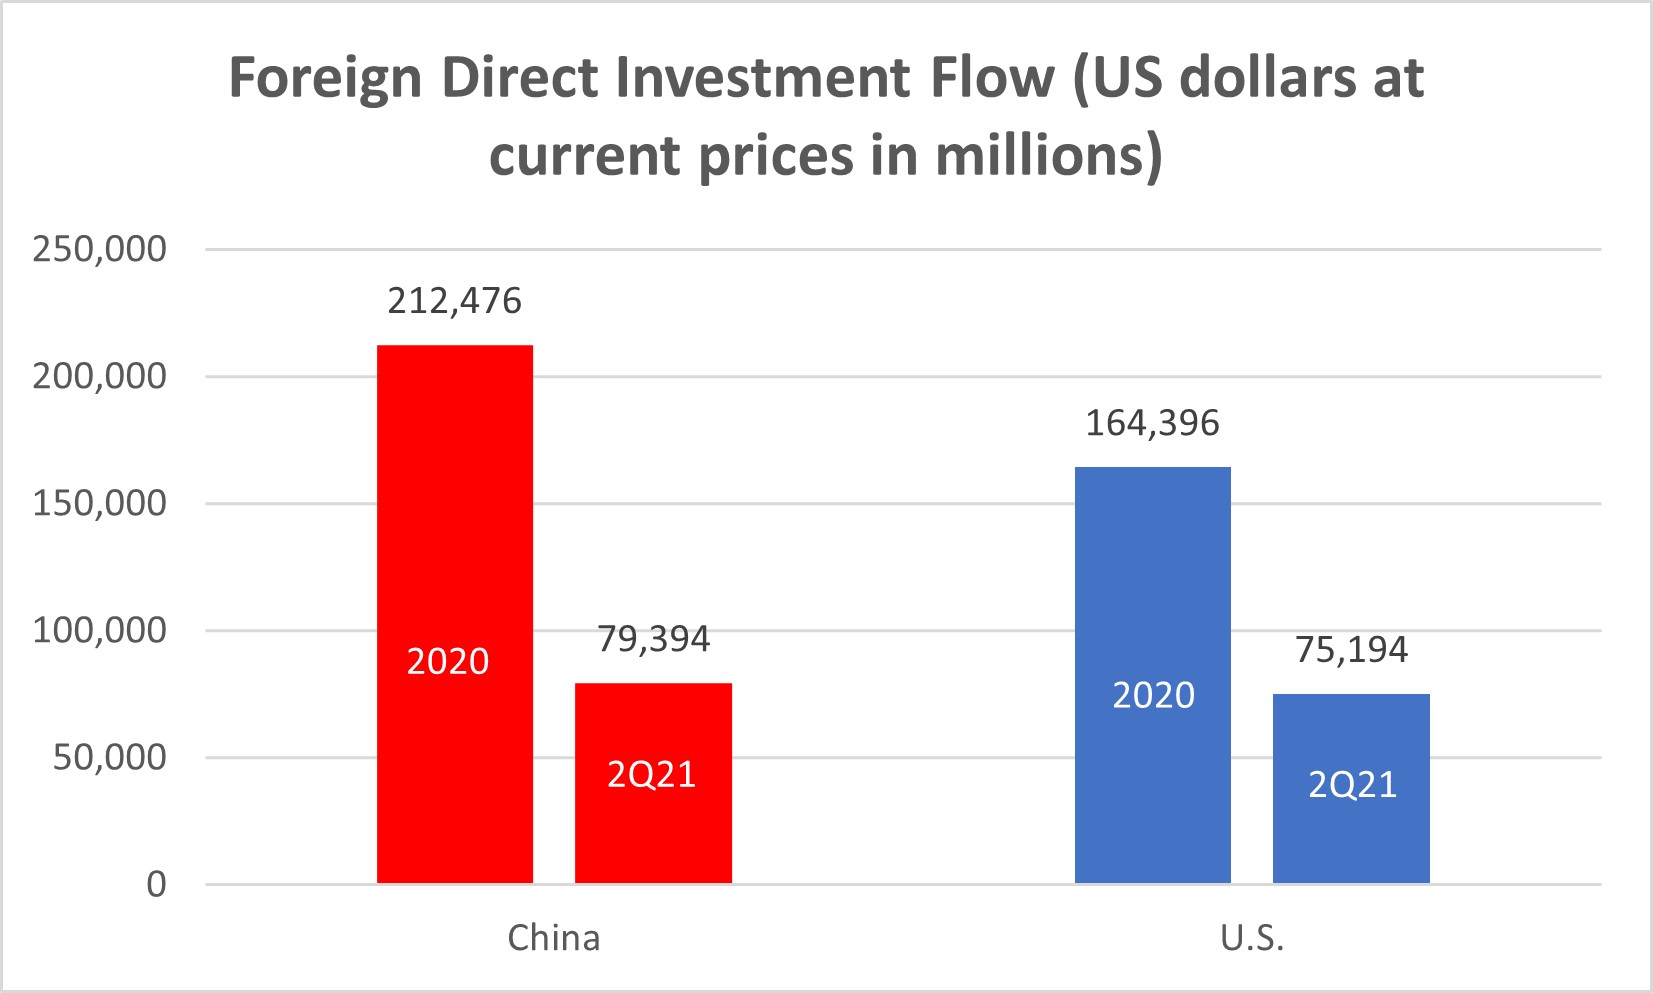
There’s no decoupling in terms of investment. China was the leading destination for foreign direct investment in 2020 and in the first half of 2021.  Source: OECD Will update quarterly

As has become more clear due to disruptions during the pandemic, semiconductors are a key and not overly resilient component of the global supply chain. The most sophisticated semiconductors are nearly all made in Taiwan (with a few by Samsung in South Korea). The U.S. and China are both interested/keen in joining the bar on the far left.  Source: Semiconductor Industry Association Will update annually

Environment

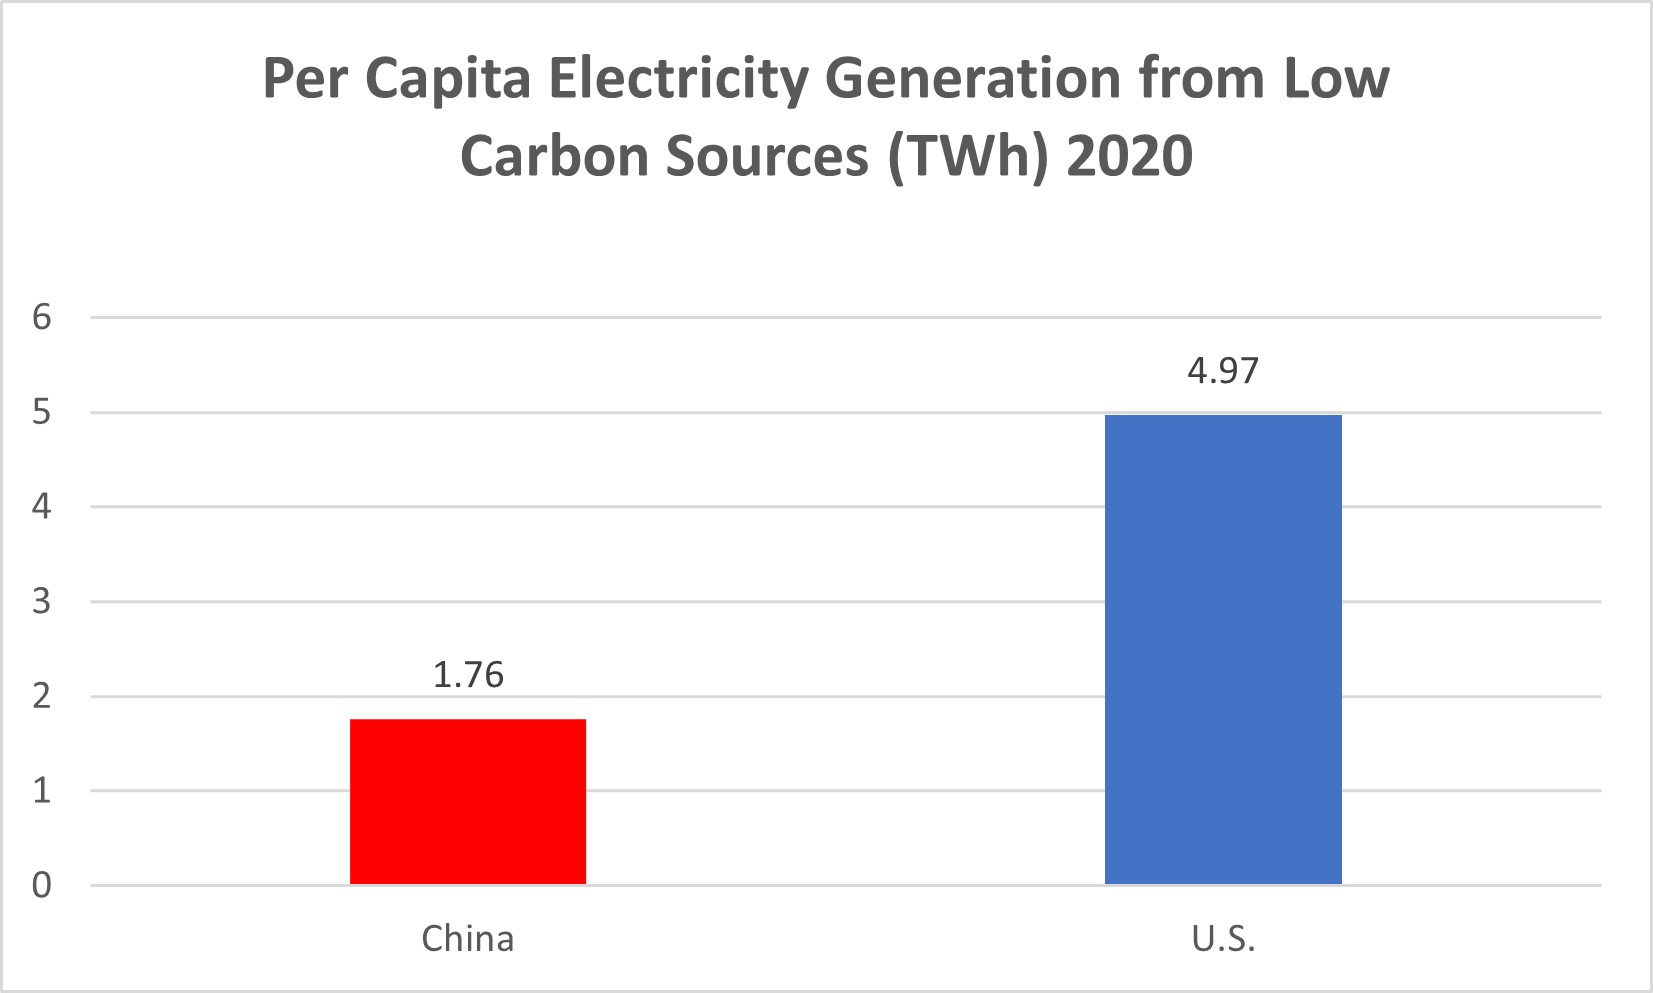
The world has learned (often too slowly) how important environmental factors are, as well as that environmental effects are transnational. China is complicated in this area, both the largest polluter and largest generator of energy from low carbon sources.

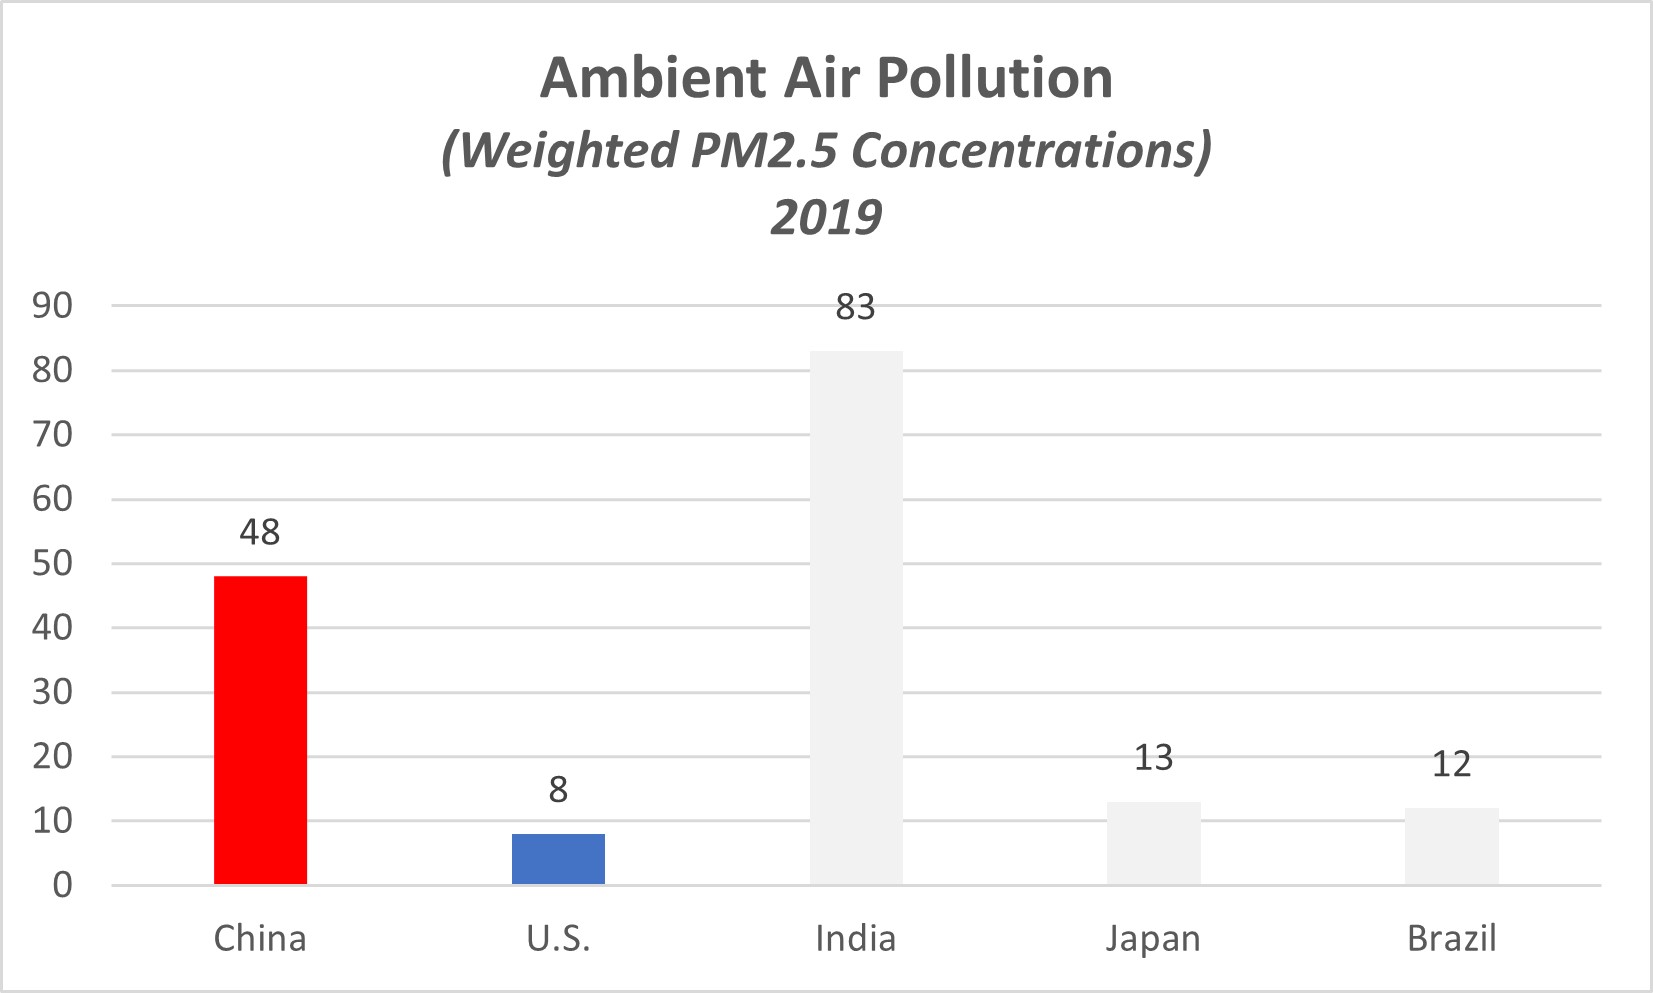
For all the understandable focus on greenhouse gas emissions, we increasingly understand the bad effects of air pollution on health, including cognitive health, and need to put more focus on reducing air pollution beyond the benefits to combatting climate change. China continues to have challenges in this area. Source: State of Global Air  Will update Annually

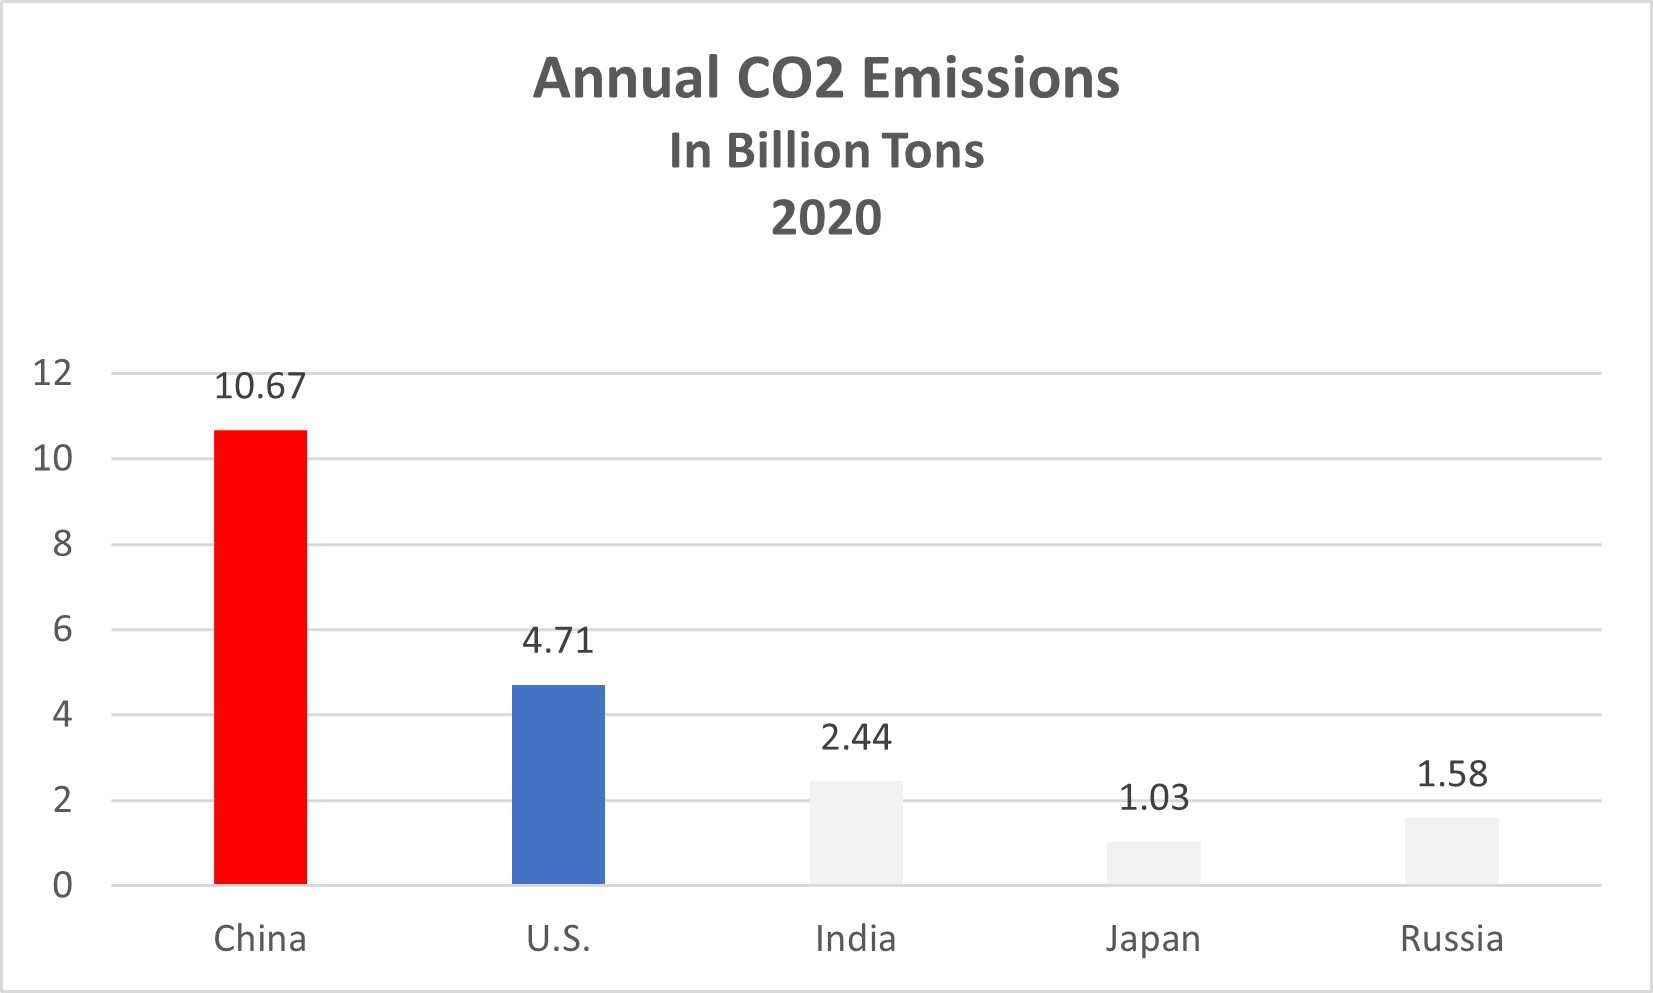
China is by far the current largest emitter of CO2 in the world. Source: Our World in Data. Will update annually

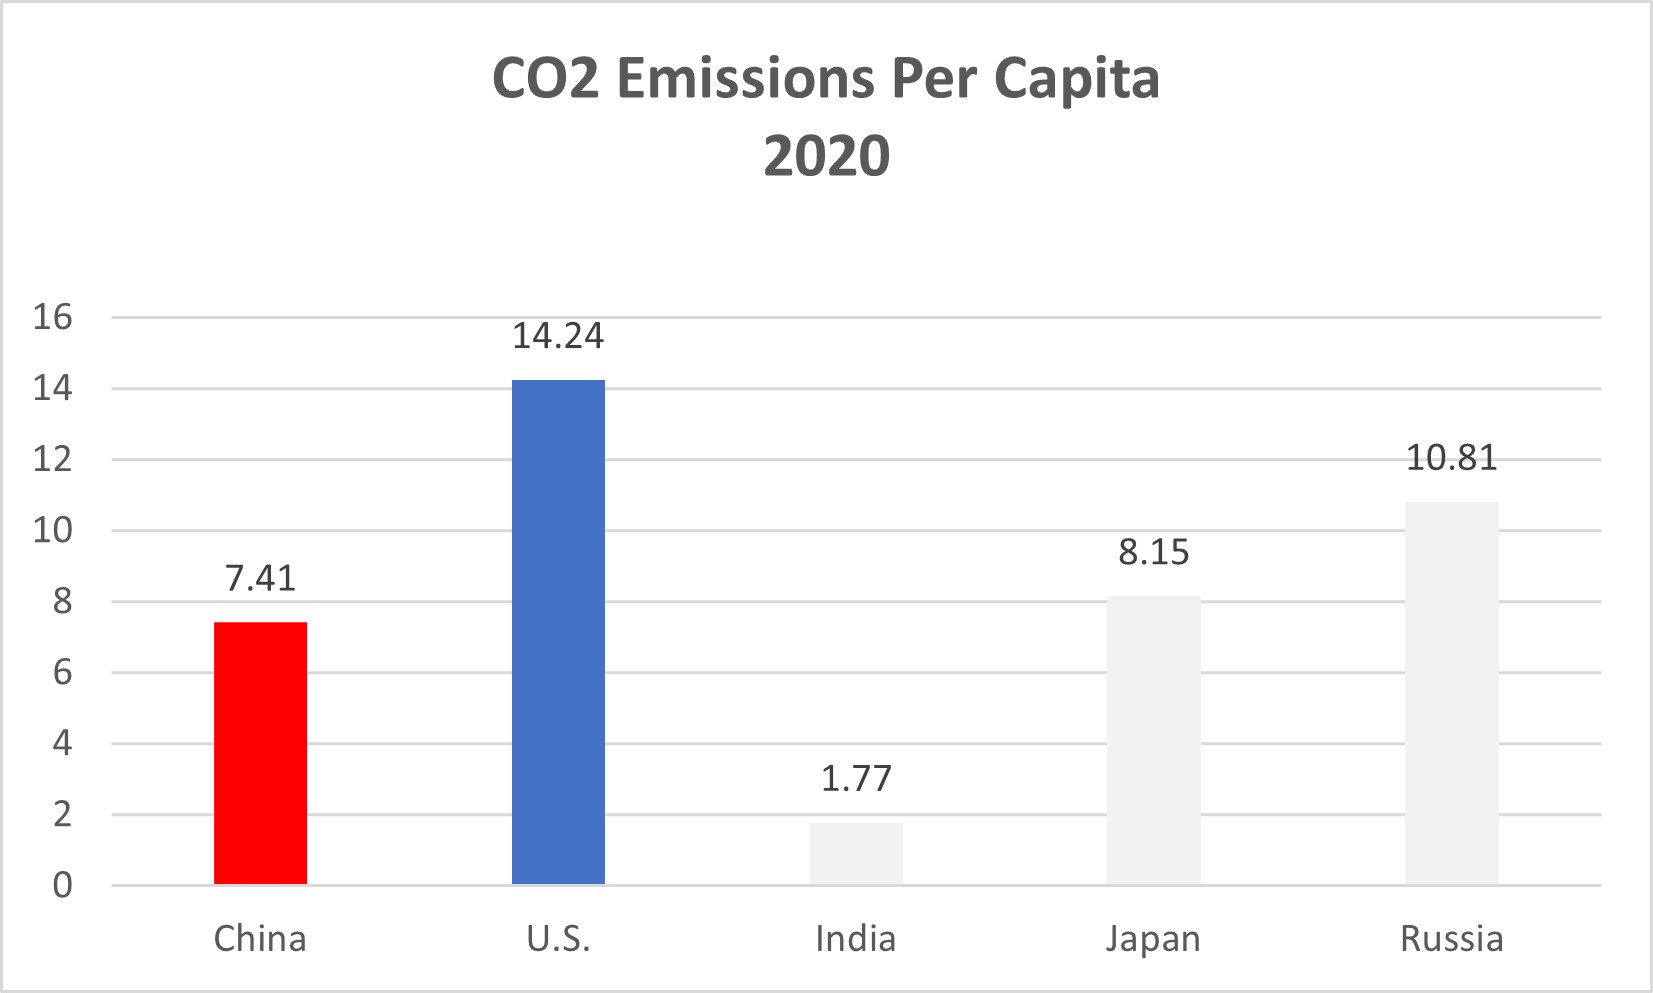
The U.S. still emits more per capita though it has been making progress in reducing emissions. Source: Our World in Data  Will update annually

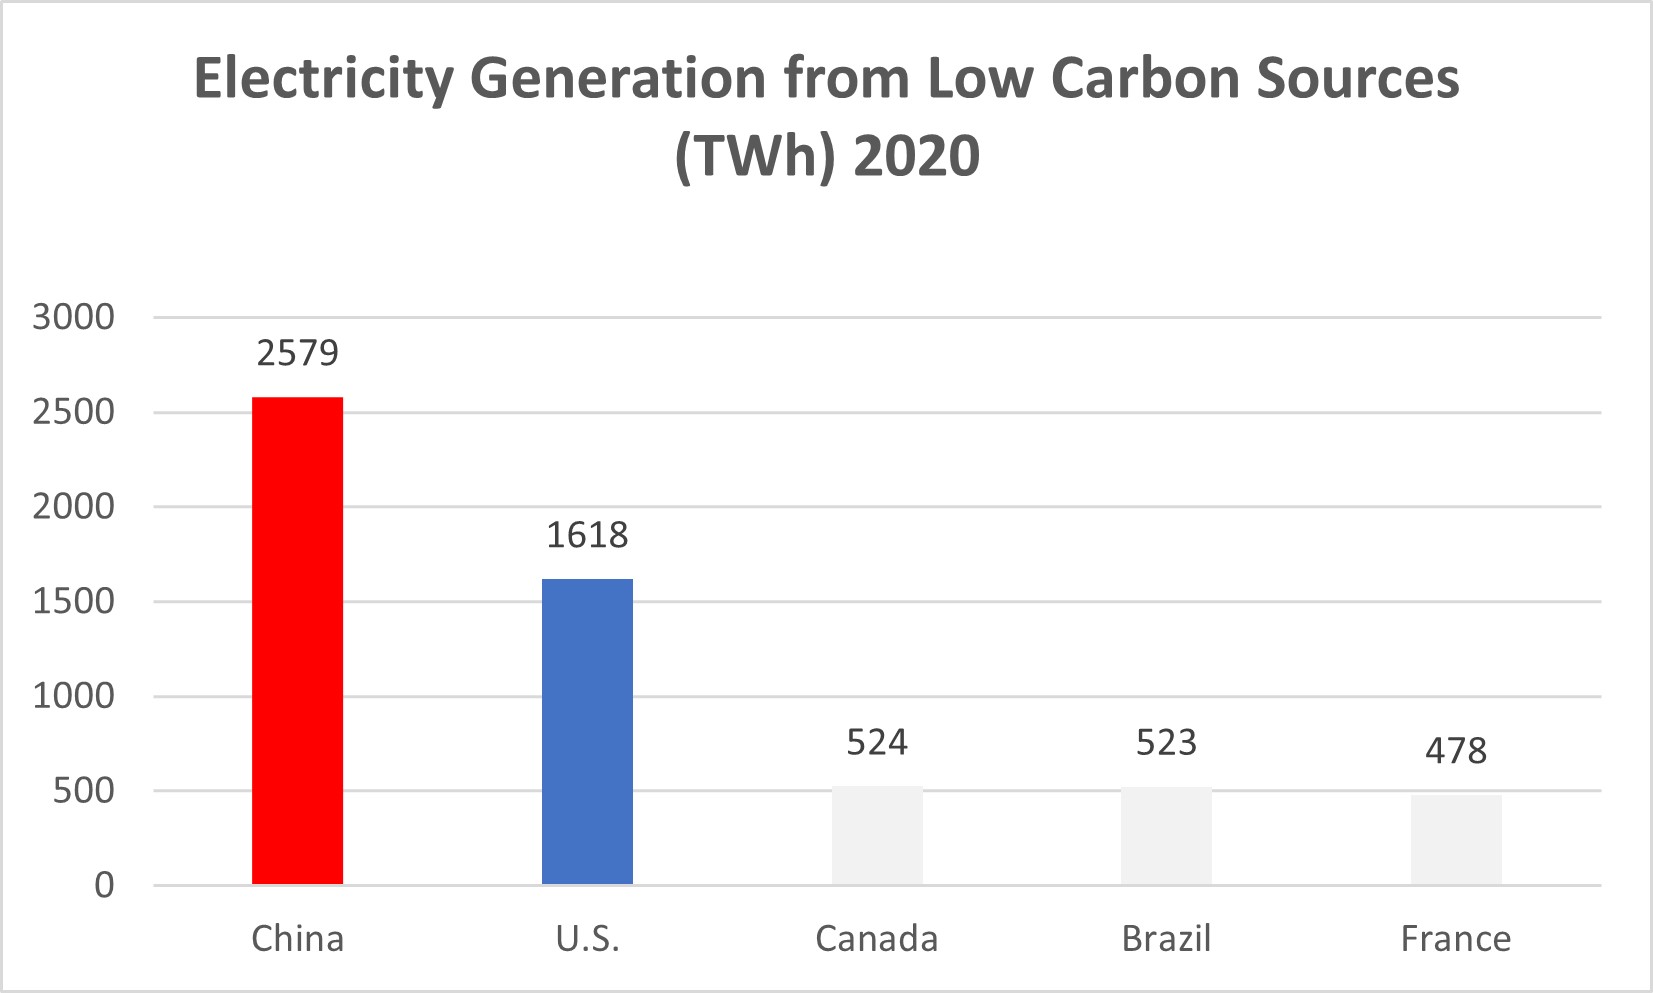
China is the largest emitter of CO2 but also the largest generator of energy from low carbon sources. Source: Our World in Data  Will update annually

On a per capita basis the U.S. is doing better than China. Source: Our World in Data  Will update annually

Social

Ultimately, how well our lives are lived is the best indicator of how a country is doing (though, of course, economic growth plays a huge role in this).

The elite Chinese do well on international tests but rural Chinese continue to have less access to education. America, of course, has its own educational challenges. When ex-pat Americans move back to the U.S. and place their children in school, they are often amazed at how far ahead their kids are compared to the rest of the children in class. Source: UNDP  Will update annually

Again, China’s rural population are undereducated. Source: UNDP  Will update annually

China, and the world, have made remarkable progress in reducing infant mortality over the last 40 years, but China still lags behind fully developed countries. Source: World Bank  Will update annually

The U.S. should not be proud of its life expectancy record which has actually regressed in recent years. This is partly because of opioid deaths and other social issues. Lots of historical ironies that fentanyl often comes from China.  Source: World Bank  Will update annually

Over the last decade, China has become increasingly oppressive against its own people, including in restricting freedom of the press, which was already remarkably restricted. It’s worth remembering that a government that is afraid of its own people is a sign of weakness not strength. Source: Reporters Without Borders  Will update annually

China is remarkably hostile to women. And, the Xi government has cracked down on what was a burgeoning feminist movement over the last half decade. That’s a lot of talent they’re preventing from helping them in the competition. As we were going to press, the 2021 rankings came out so this our first graph with historical data. As you can see, both China and the U.S. fell in the rankings from 2020 to 2021. Source: World Economic Forum  Updated Annually

For another project we are working on (stay tuned!), we have created an index of cultural influence. It combines merchandise cultural exports, number of UNESCO Cultural Heritage Sites, country origin of TikTok stars, and country origin of artists on the Billboard Global 100. Source: Sam’s Cultural Index (link coming soon)  Will update quarterly

Where will these two economies be in ten years? 20 years? Perhaps their abilities in innovation provides a clue.  Source: World Intellectual Property Organization  Will update annually

There is lots of apt criticism of happiness indicators but nonetheless it is worth keeping track of these rankings. We use the World Happiness Report. Don’t like it? Don’t worry, be happy.  Source: World Happiness Report  Will update annually

State Capacity

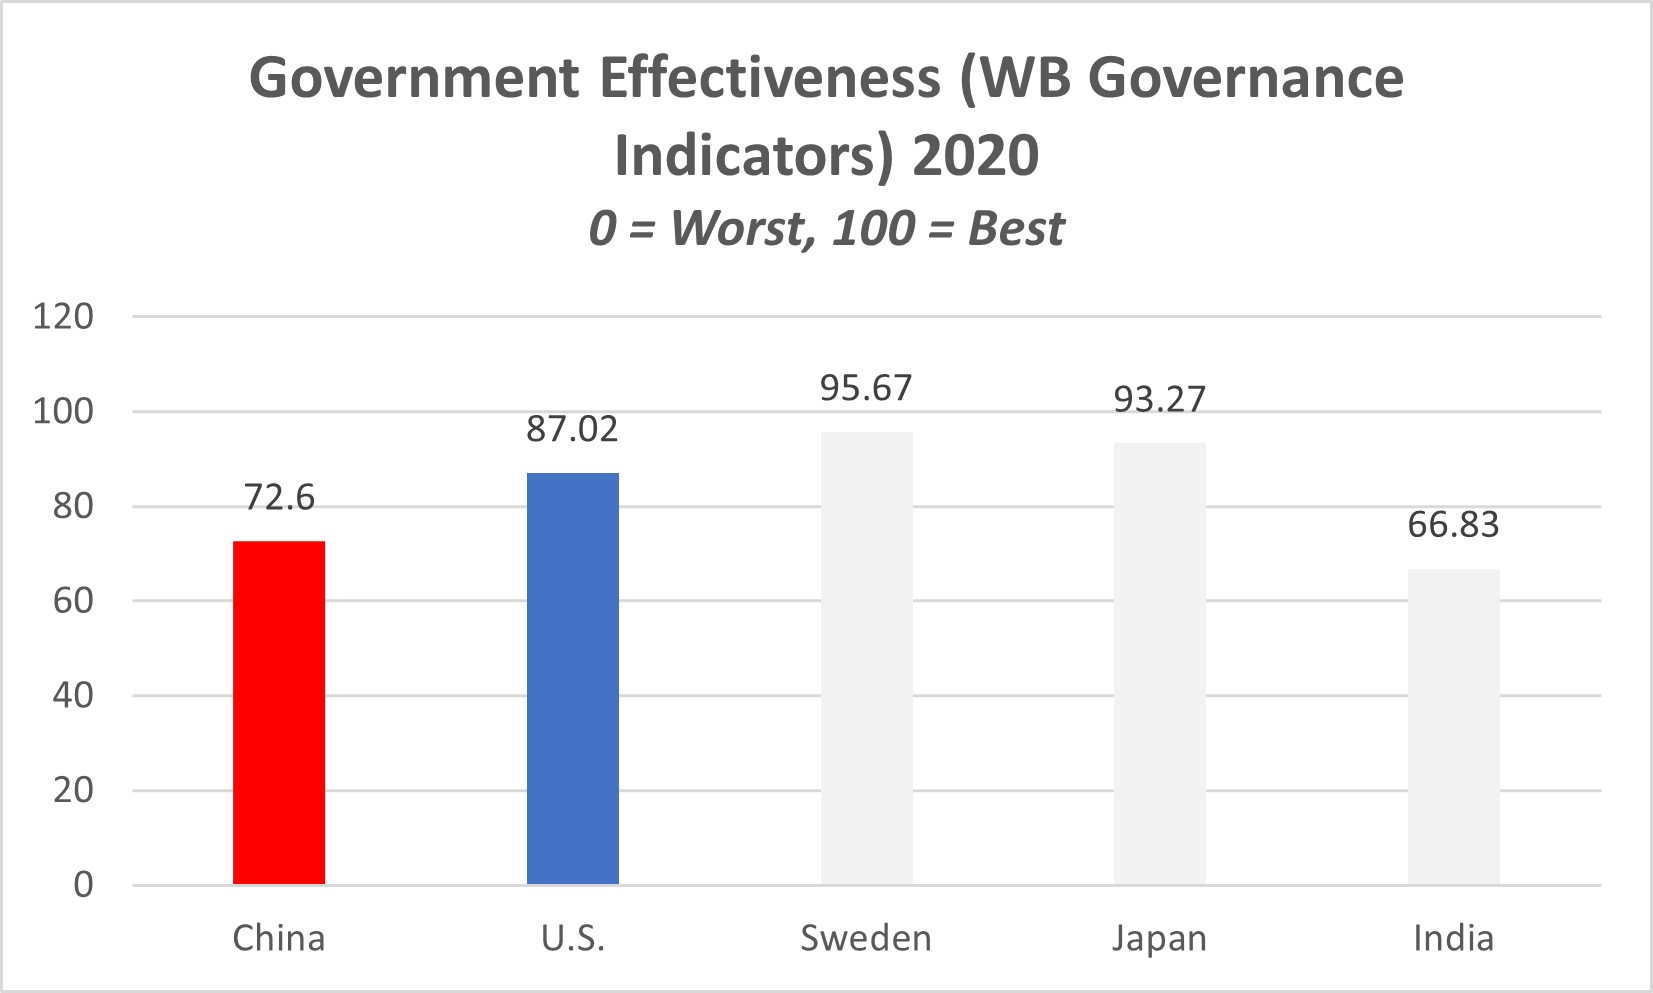
Governments ability to get things done is a key factor in a country’s success. China and the U.S. have differing challenges in this area. Note: We wanted to include data on infrastructure but could find no good sources for ranking countries infrastructure. If you know of one, or a way to do so, please let us know.

Even with its sclerotic nature and chaos of recent years, the World Bank Governance Indicators still rank the U.S. government as more effective than China. Source: World Bank Governance Indicators  Will update annually

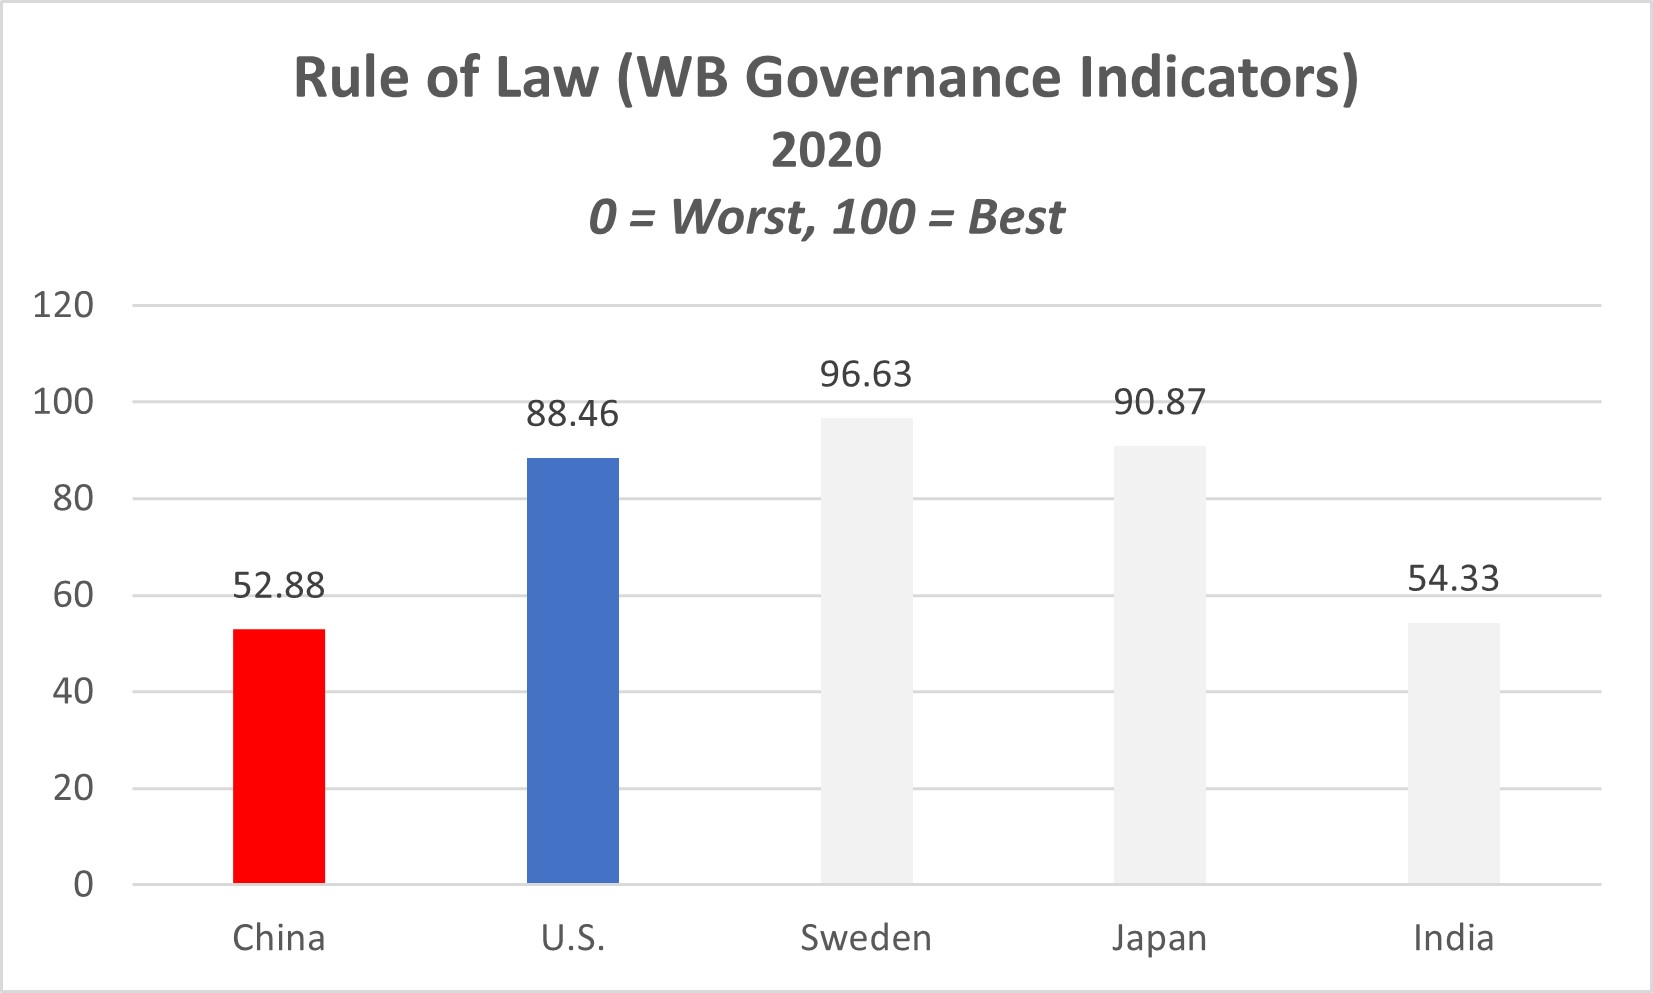
If the China model fully replaces the previous flawed but evolving rules-base liberal international world order, we will live in more of a wild west atmosphere that will create more friction in the economy. This will create slower economic growth and thus retard future poverty alleviation and progress compared to the last 70 years. Source: World Bank Governance Indicators  Will update annually

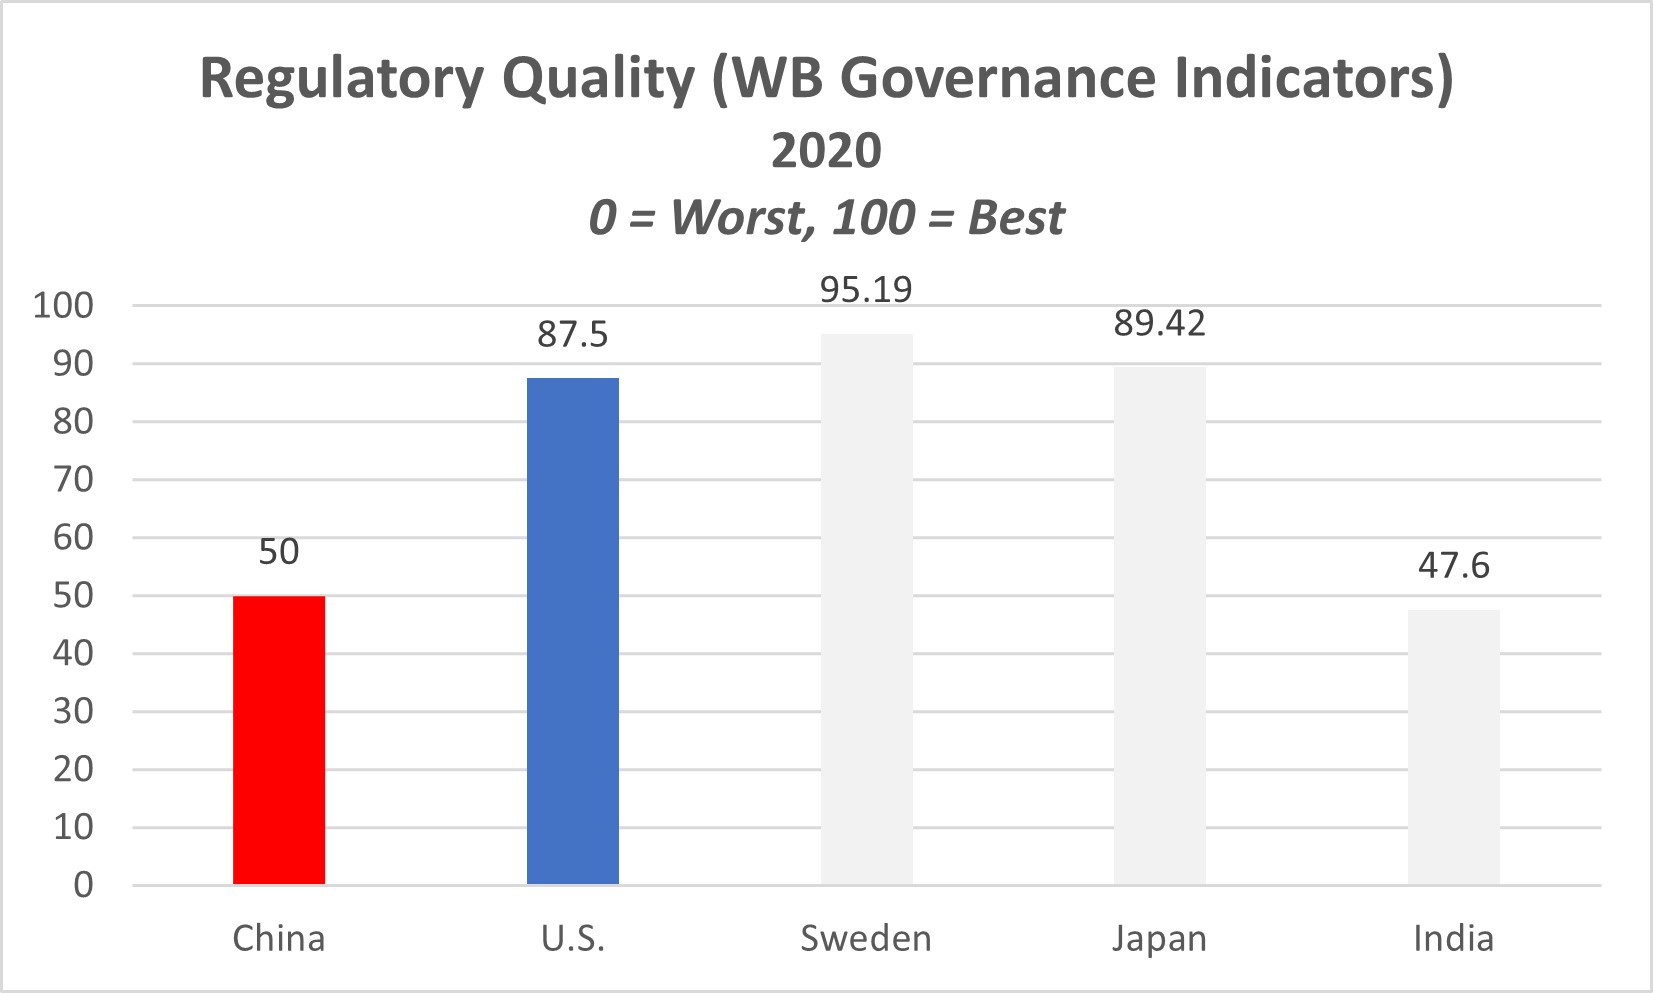
We assert the U.S. is neither over or under regulated, but badly regulated. Nonetheless, China is even worse, according to World Bank Governance Indicators. Source: World Bank Governance Indicators  Will update annually

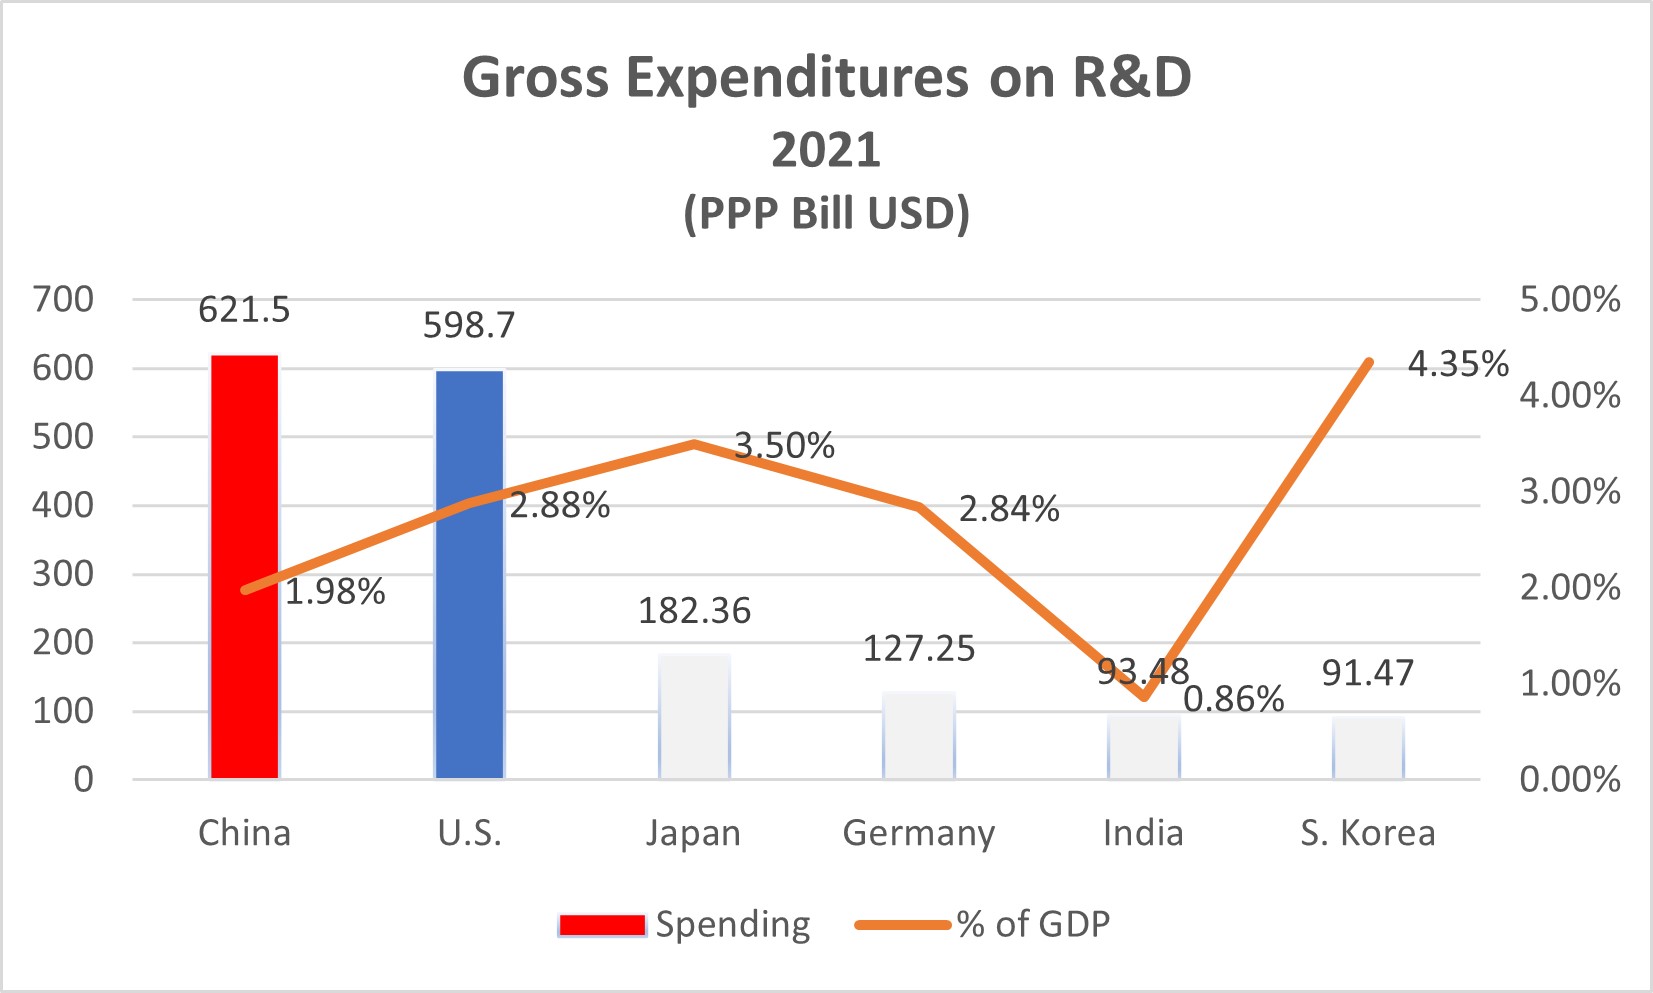
China has been increasing spending on R&D and in cracking down on the consumer software industry is trying to encourage investment in robotics, AI, clean energy and other industries they deem strategic. R&D spending in the U.S. has mostly been flat and even declined occasionally. Certain U.S. private sector and academic experts are working to revamp how R&D funding is done.  Source: R&D World  Will update annually

Demographics

Demographics may or may not be destiny but it’s an important determinant.

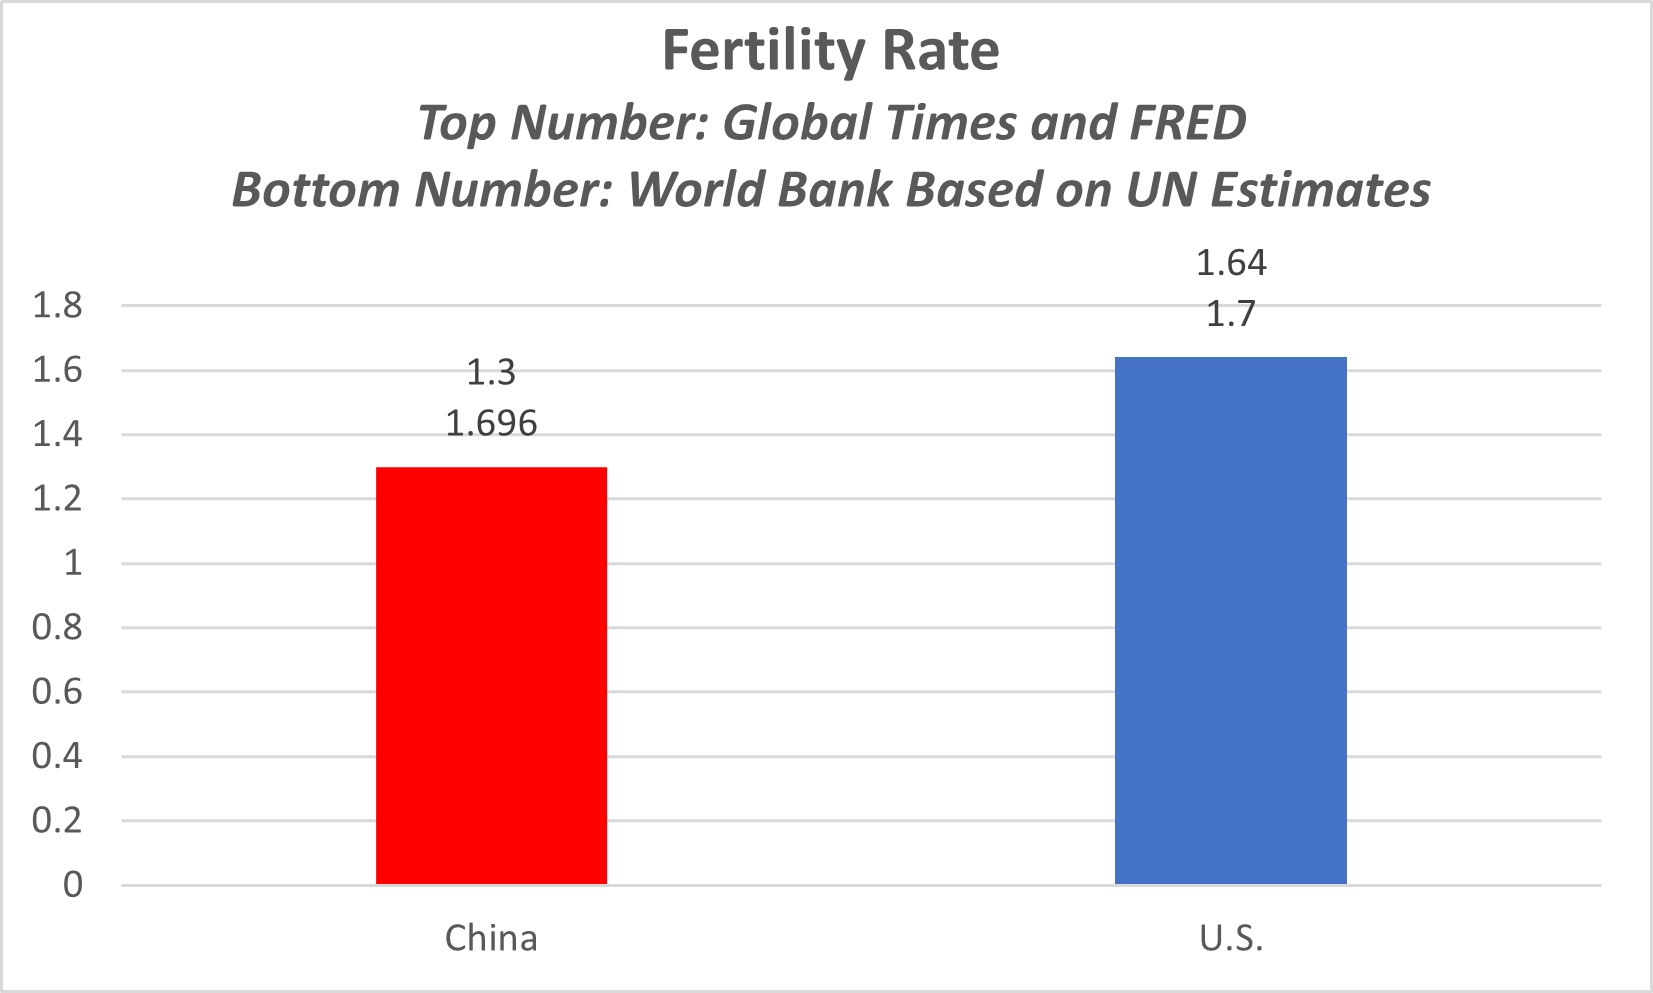
China’s fertility rate has fallen precipitously in recent years.  The United States recently fell below replacement level. The World Bank/UN data lags what has been reported in both Chinese and American media about current fertility rates. We use both the new numbers from Chinese and American news reports (top number and reflected in the bars) and the World Bank/UN’s official but older numbers (bottom number). Chart links to World Bank. Source: Global Times, FRED, World Bank using UN population estimates.  Will be updated annually (unless fresh numbers arrive sooner).

Note: on January 17th, Reuters reports that China’s “birth rate dropped to a record low.” And that’s from official data. We guess that China’s overall population is already shrinking though the government will continue to deny it.

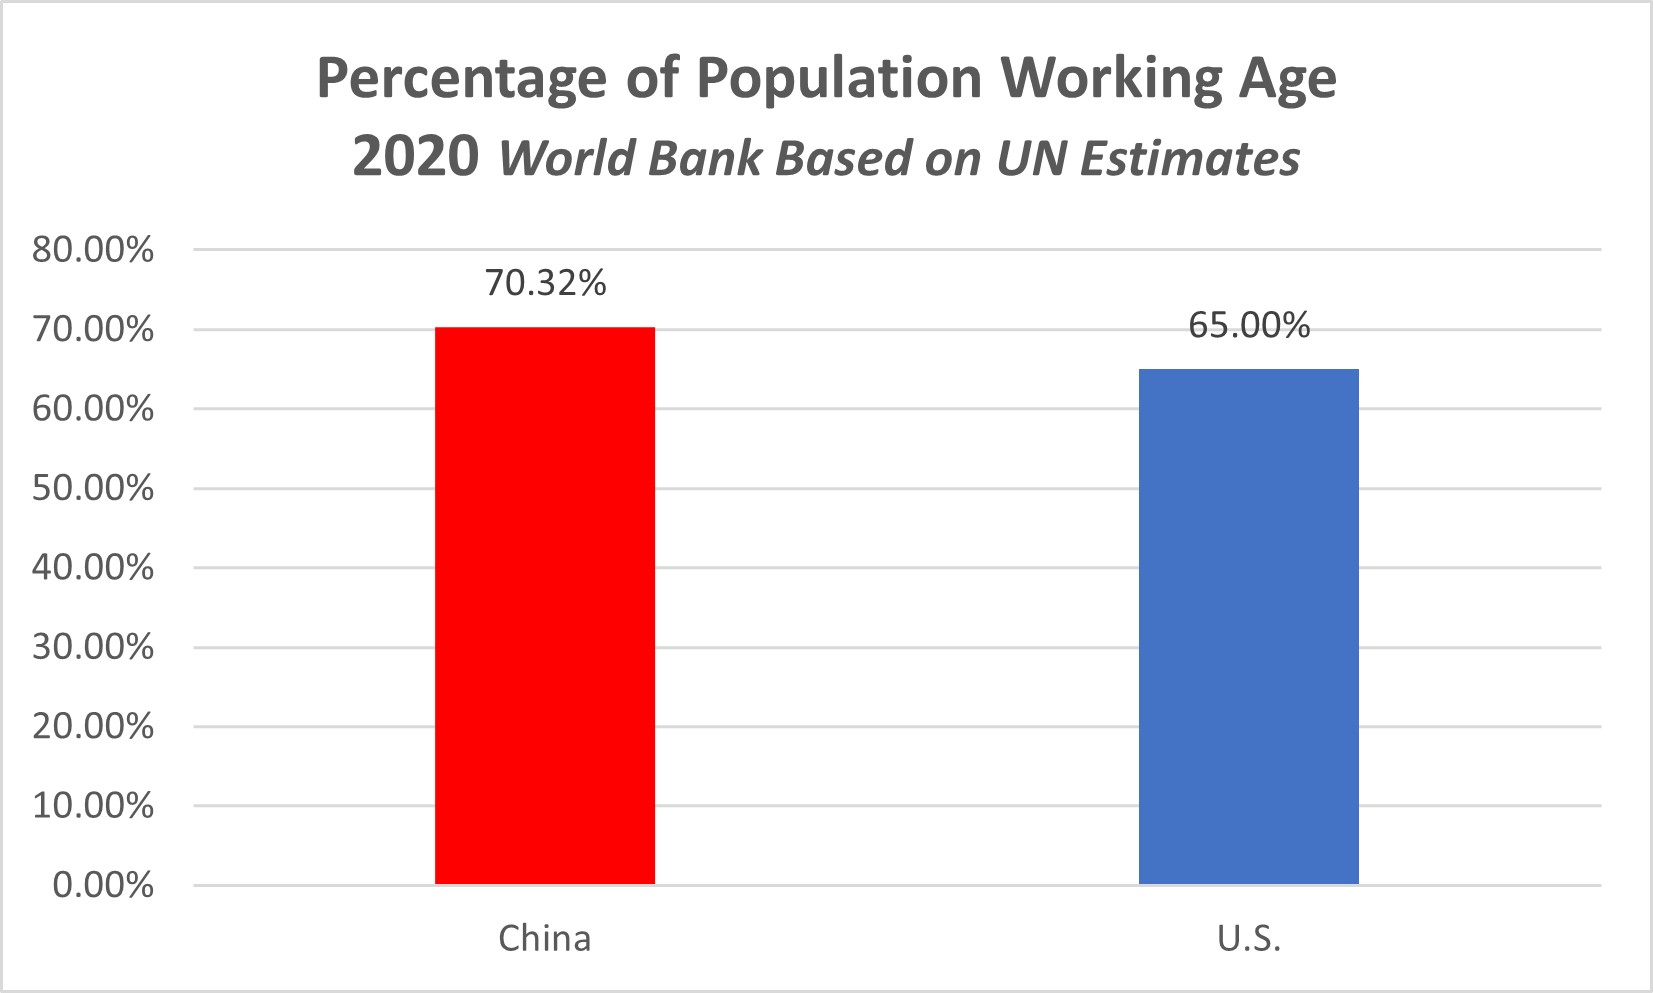
China’s working age population as a percentage of its total population is still larger than the United States but has been falling for six years.  Source: World Bank based on UN Population Estimates  Will update annually

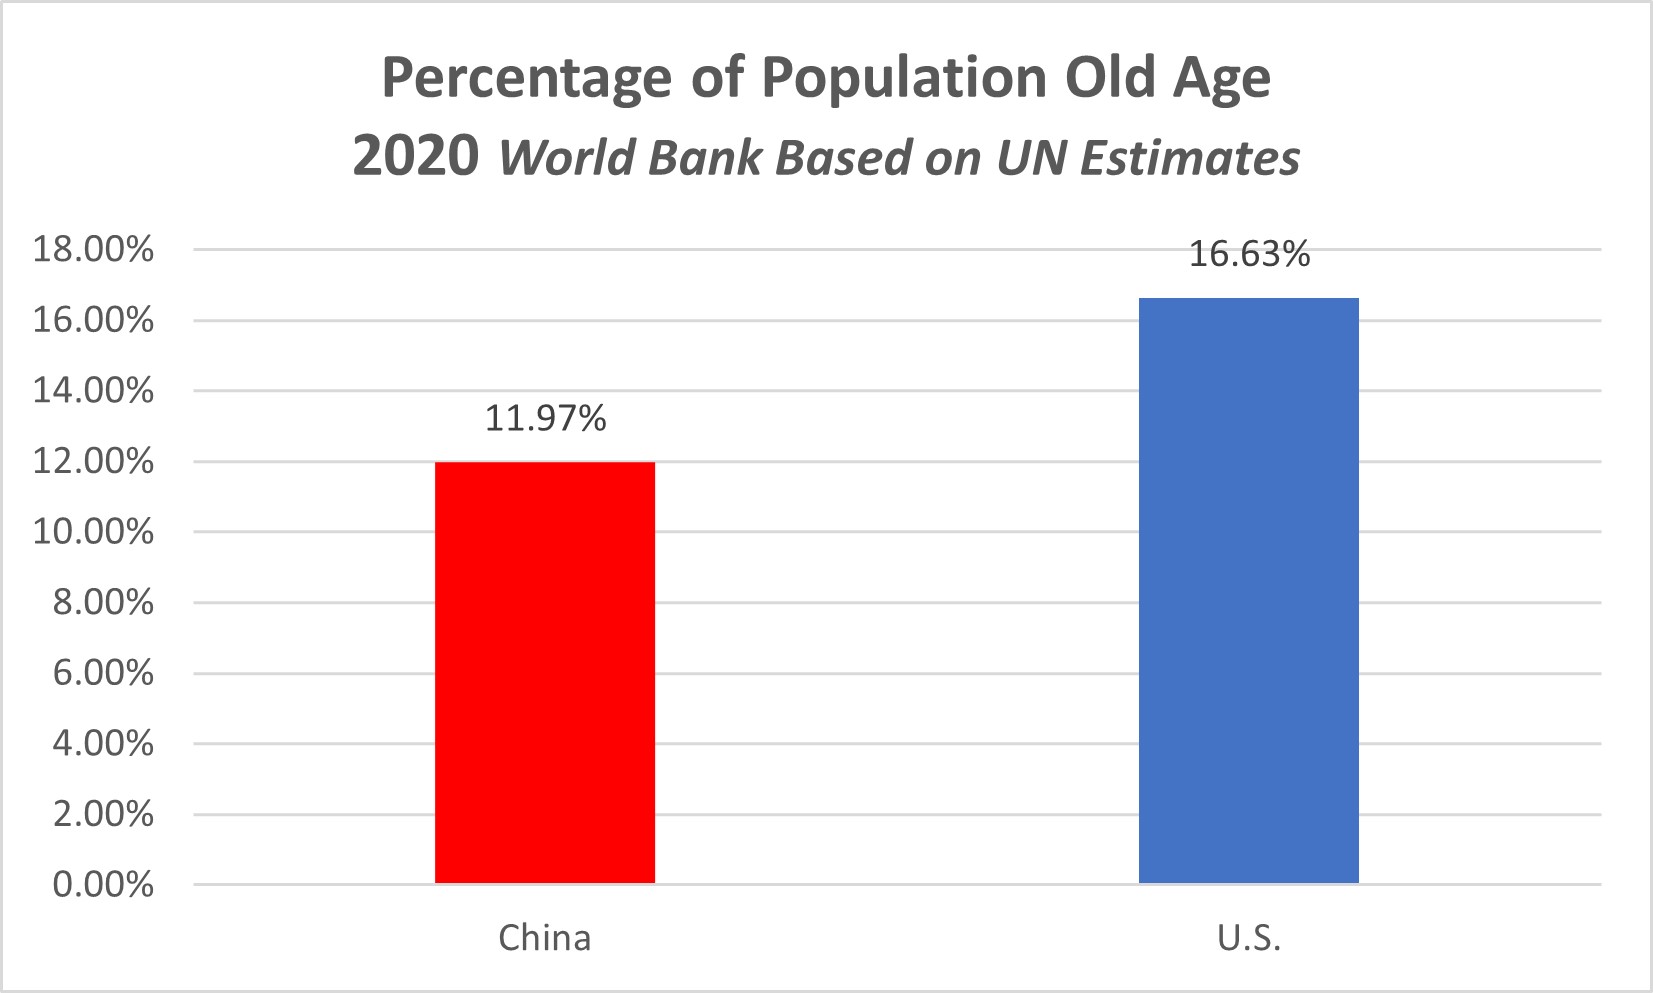
Will China grow rich before it grows old? Will the United States continue to lose ambition as it ages? Source: World Bank based on UN Population Estimates  Will update annually

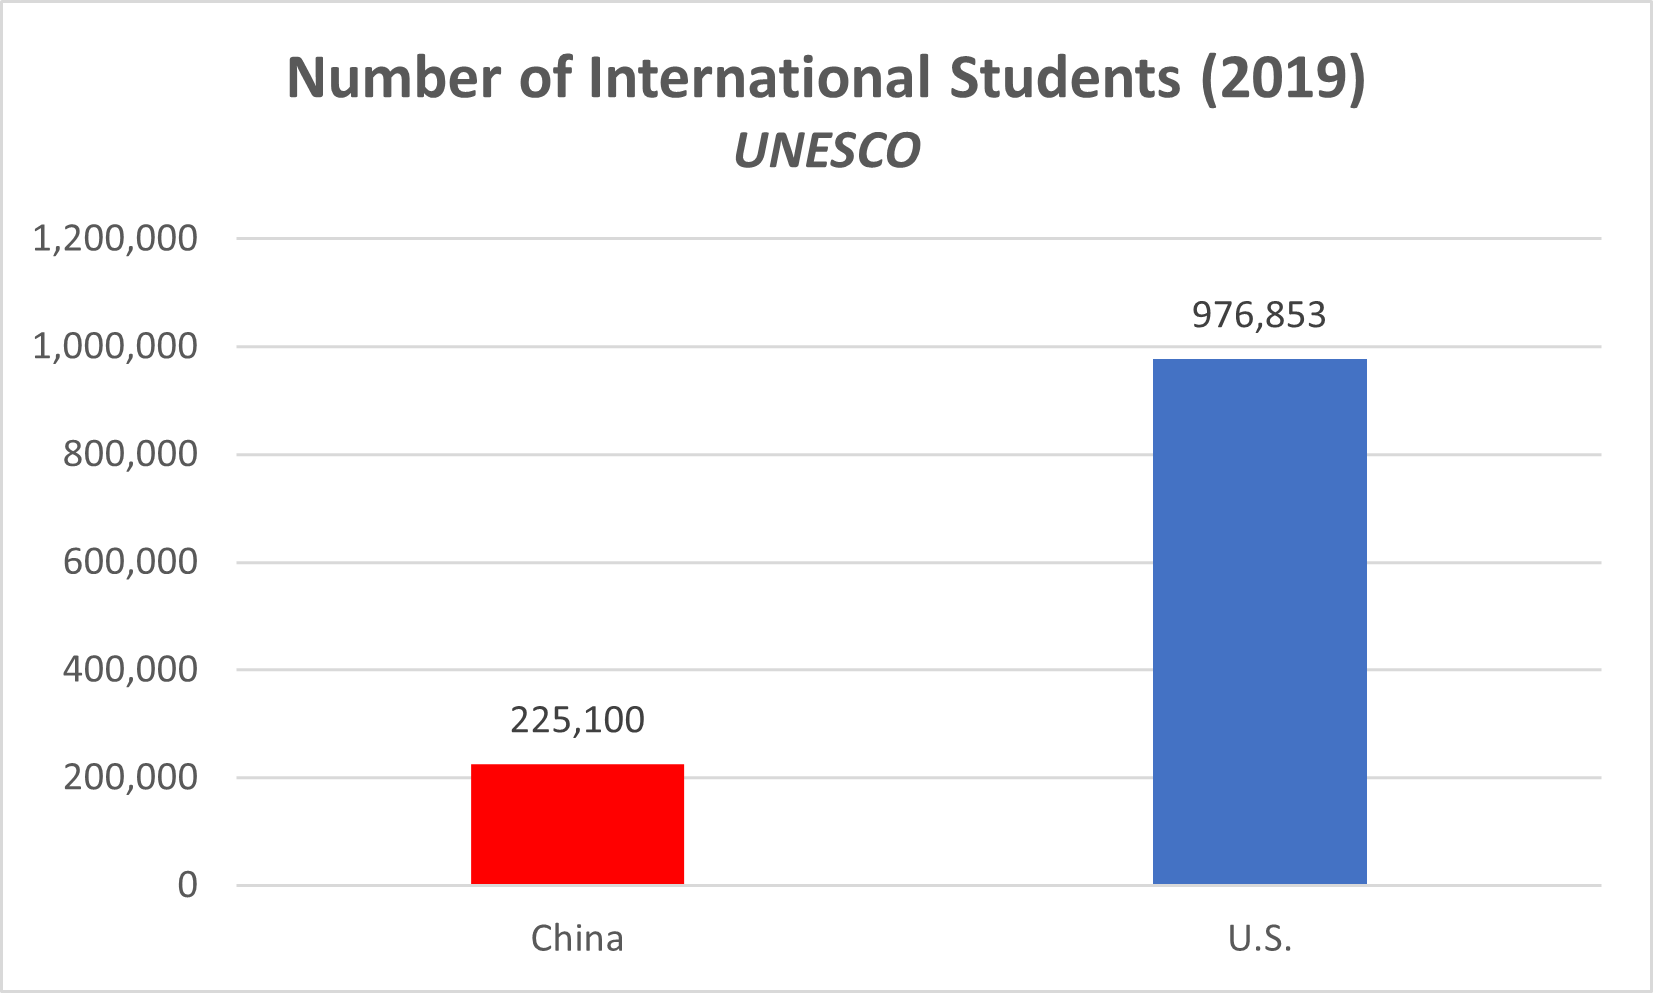
In the future as most societies age and eventually shrink, there will be a great competition for immigrants, including students. Currently, the U.S. is easily winning that part of the Competition of Competence.  Source: UNESCO  Will update annually

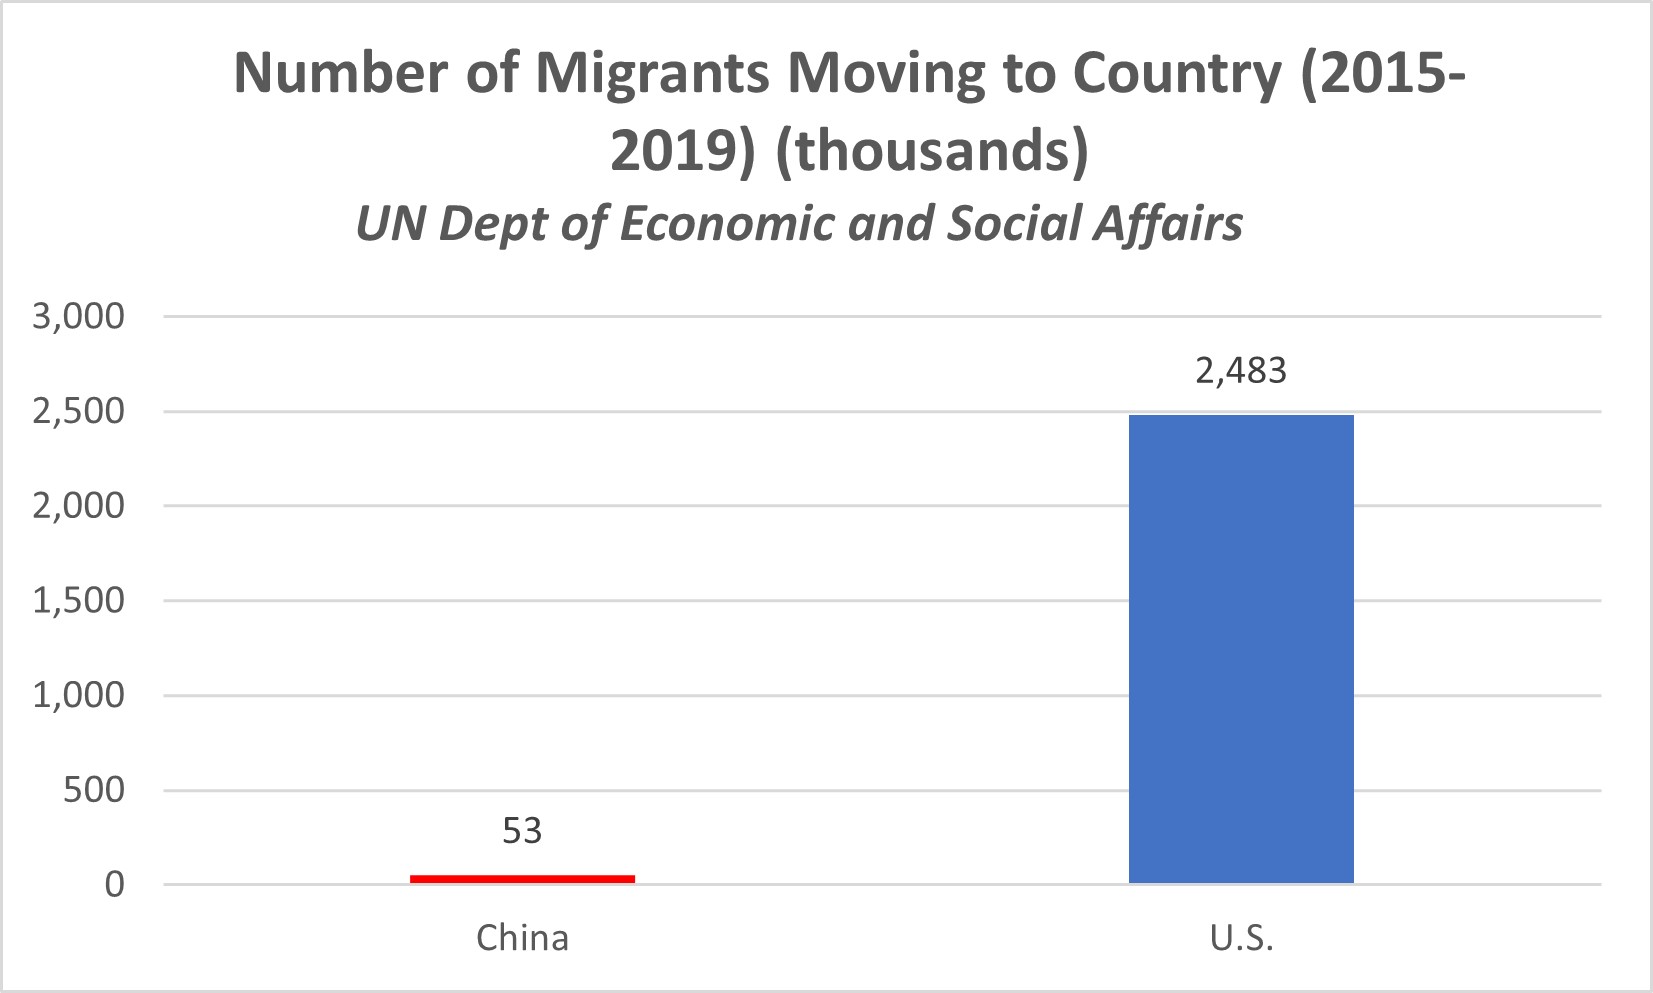
One sign of a successful country is whether people from around the world want to move there (and whether a country will accept them). For all its economic success over the last 40 years, China has a very small migrant population. We predict in the future, as most countries have aging demographics, there will be a great battle for immigrants. That will likely be a tough competition for China to win. Source: UN Population Division Will update annually