The U.S. and China are in, we’re told, a competition. The Biden administration is fond of calling it a “strategic competition.’ Xi Jinping himself has stated that the two countries are competing and that China must lay “the foundation for a future where we will win the initiative and have the dominant position.” We agree there is a competition though we describe it as a “Competition of Competence.”
However, in other competitions we follow, whether it is the Seattle Mariners baseball team (who for two decades have been losing) or the Green Bay Packers (who are winning but bruising our pandemic heart with their vaccine-denying quarterback) or in our own household where we compete with our spouse over who cleans the kitchen counters the most and best (this competition is perhaps as difficult to judge and as contentious as the U.S. – China one), there is an effort by observers to keep score. Or, at least, to track how the competitors are doing. We don’t see such an effort with the U.S. – China competition, at least not in a consistent, comprehensive way. And so we have taken it upon ourselves to do so.
We created a U.S. – China Index. It tracks data in easy to understand charts across five broad categories: a) economy; b) environment; c) social; d) state capacity; and e) demographics. We might in the future add a sixth category, military, but are still determining how best to measure that aspect of the competition. The U.S. – China Index is a beginning and we will likely add data and/or make other changes to it as we move forward—we welcome your suggestions. But, we have at the least created a place where observers of and people interested in the competition can keep track of it. And so this week we depart from our usual format to highlight three charts from the U.S. – China Index. One dealing with the economy, one with the environment and one with demographics. It’s this week’s International Need to Know, the man behind the left field fence putting up numbers on the hand-operated scoreboard.
Without further ado, here’s what you need to know.
Catching Up on the Economy
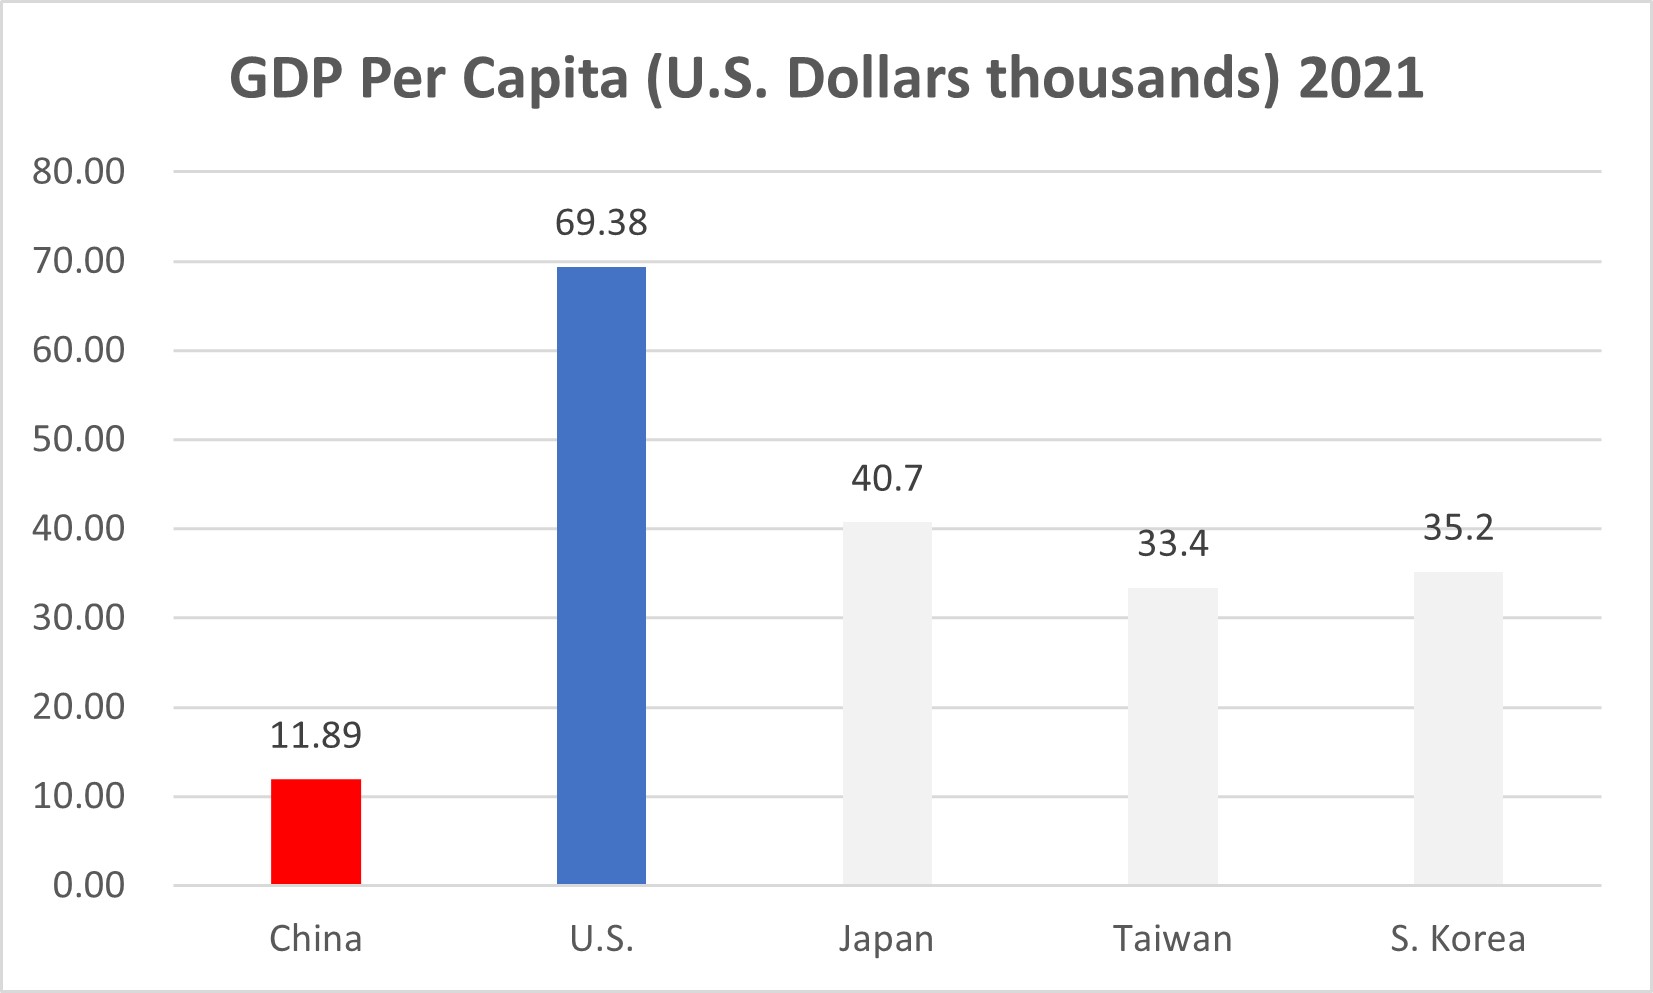
As you’ll see in the Index, China is second or first in total GDP depending on how you count it, which makes sense given their economic growth the last 40 years and the size of their population. But when looking at GDP per capita, China is not doing nearly as well, as you see in the chart below. China’s GDP per capita is less than a sixth of America’s and it’s a third of South Korea’s and Taiwan’s, two Asian tigers pre-dating the giant economic wildebeest of China. As we discuss in Challenging China, and have talked about in this space, China will no longer have high GDP growth going forward due to demographics, debt issues, the end of the urban migration boom and other factors. It will be difficult for China to catch up to Taiwan, South Korea and Japan, much less America, on GDP per capita. China’s population will soon start shrinking, it’s working age population has been shrinking for over half a decade. This new economic era for China will likely be more challenging than the previous one. China is tackling it by using industrial policy, stressing atoms over bits and talking about finally dealing with its inequality problems. How will America tackle its economic challenges?
An Environmental Contradiction
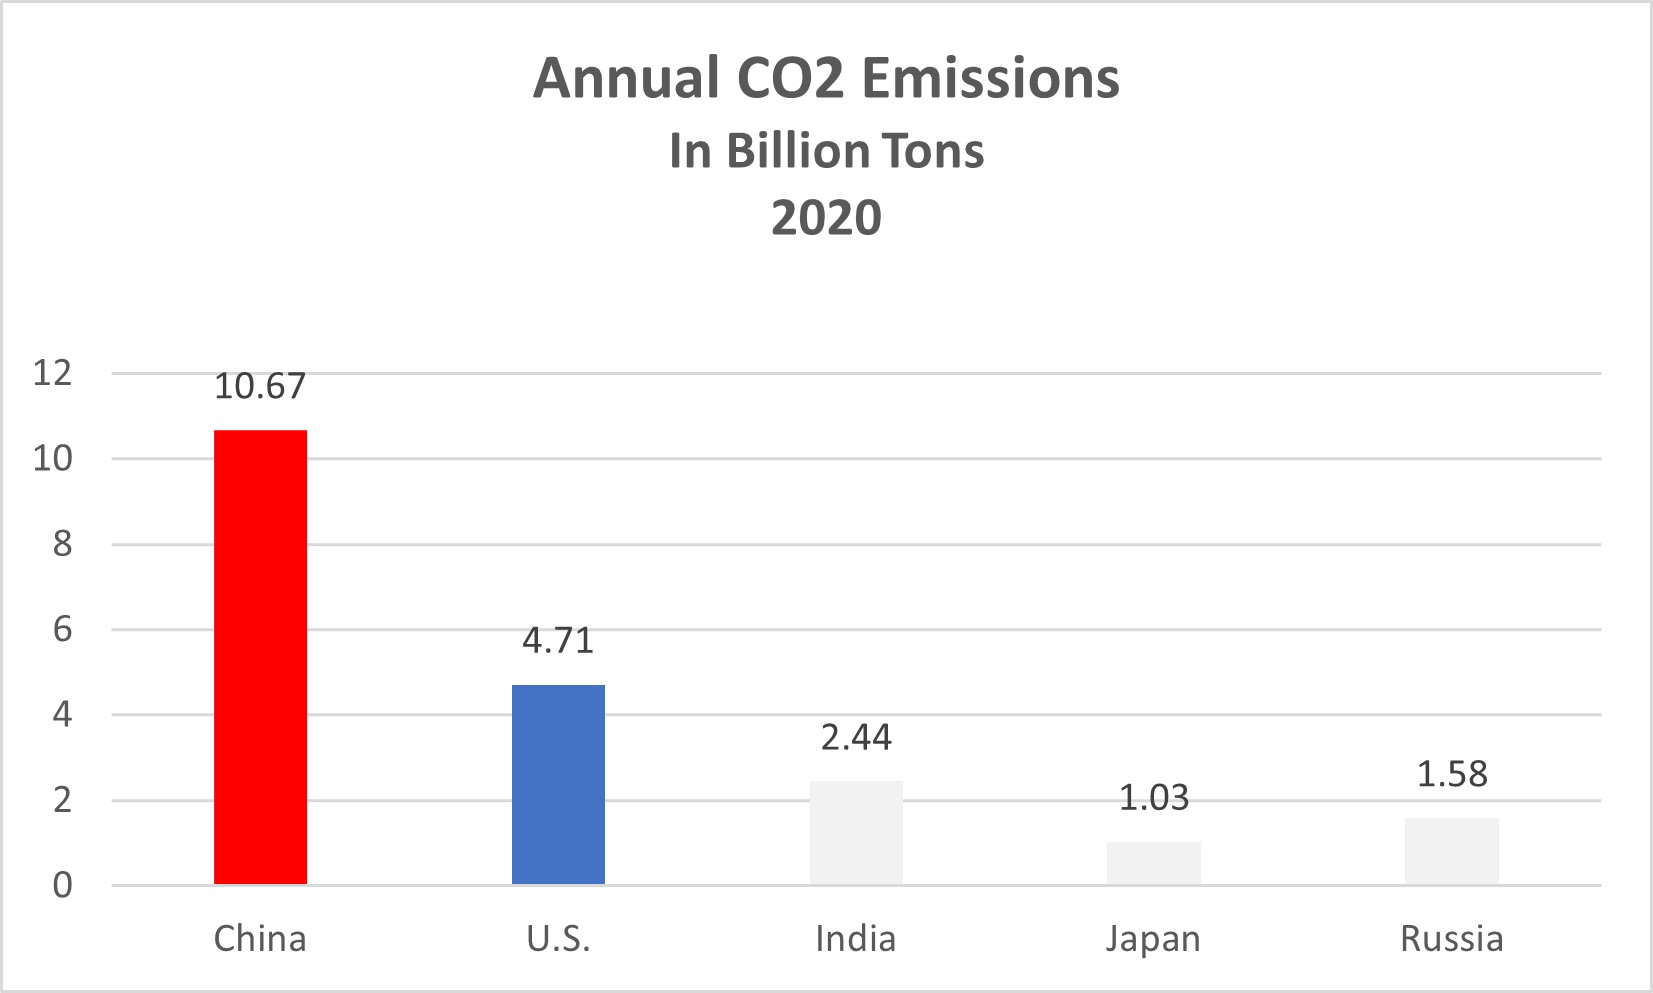
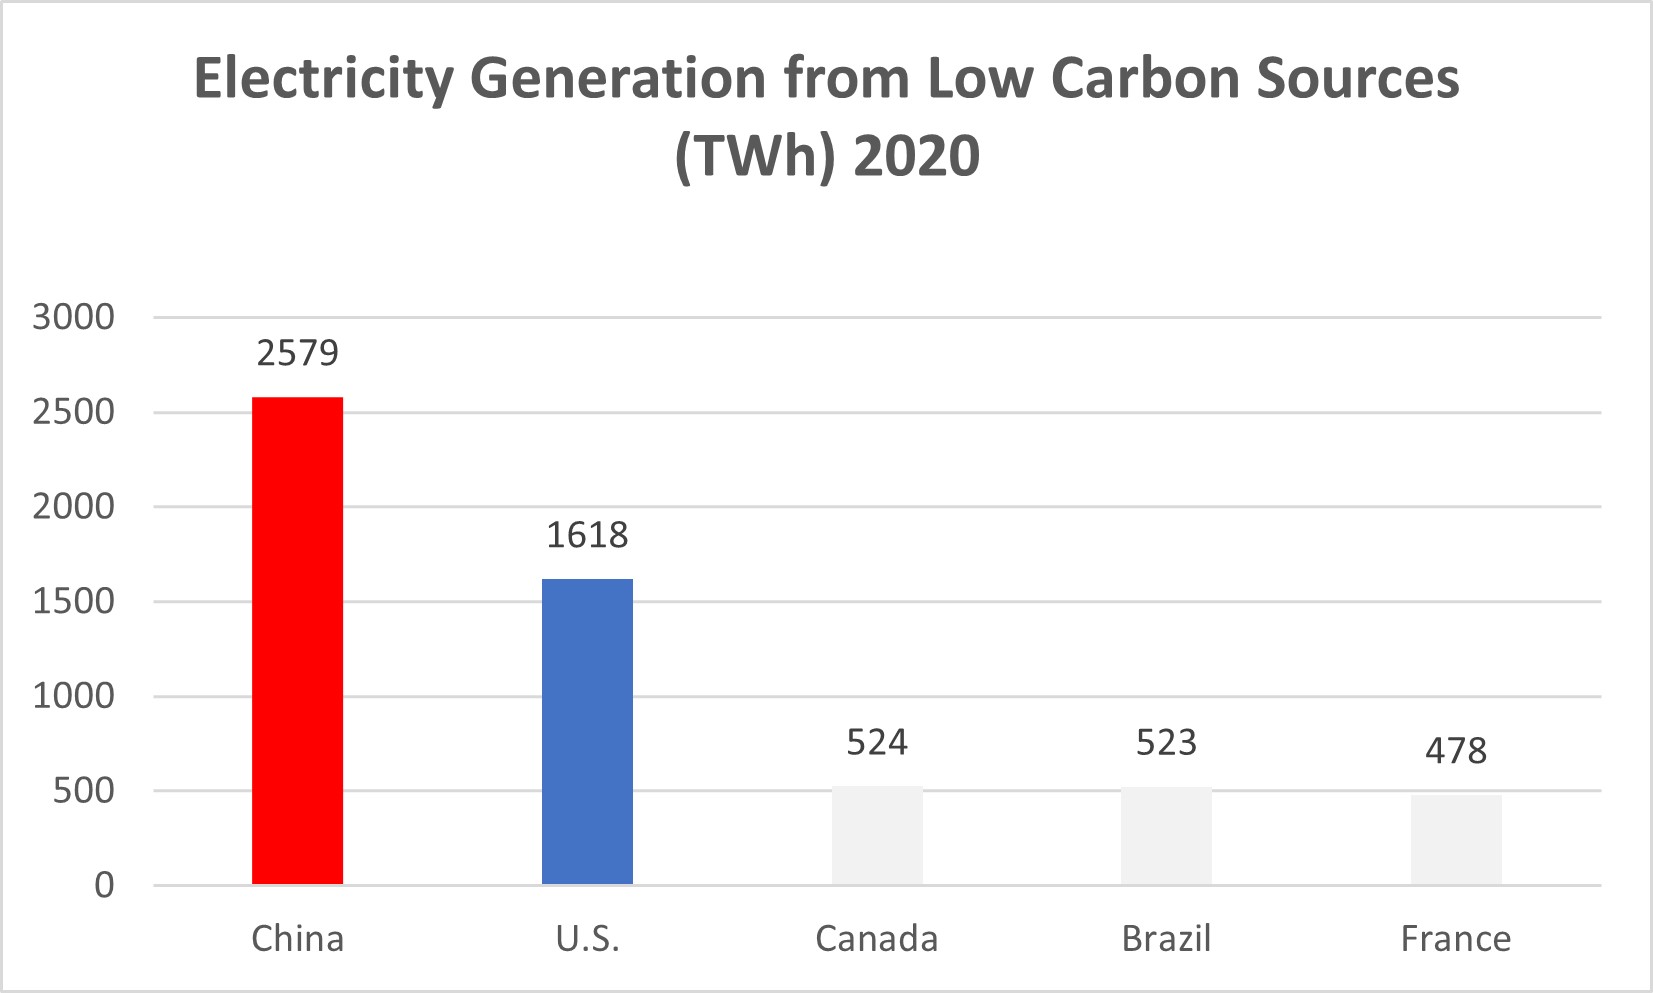
We write in our book that “China is like any large entity: there are many disparate parts adding up to an ultimately unknowable whole.” The environment is a great example of China’s complexity. China is the largest emitter of CO2 in the world as you can see in the first graph below, emitting far more than the U.S. or any other country. But, China also generates more electricity from low carbon sources than any other country in the world, as you can see in the second chart below. China is the leading manufacturer of solar panels and installs a lot of them in its own country. What this second chart really speaks to is the fast-moving energy transformation that is taking place. China’s leaders don’t care about climate change, or at least they care a lot less about it than keeping their economy humming, which they care about because it keeps the CCP in power, which is what they really care about. Solar energy is now more affordable than new coal plants and is a strategic technology. That is what will drive China’s climate change policy.
Voting With Your Feet
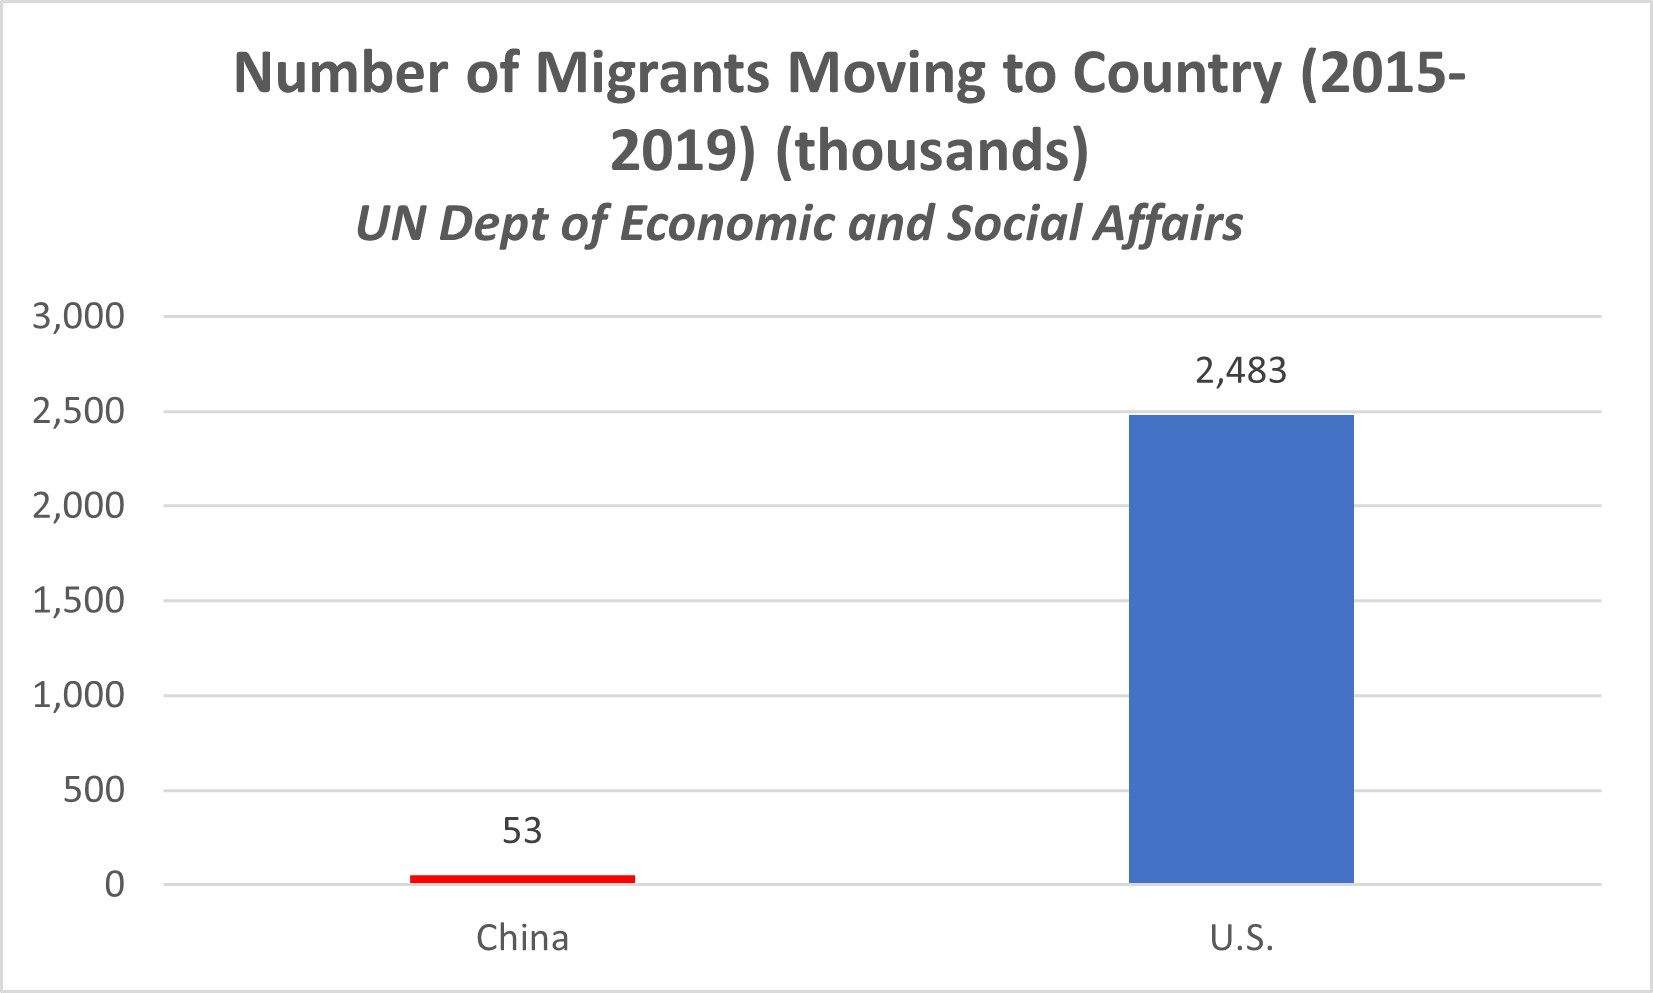
One measure in which the U.S. still leads handily is on where people want to live. You don’t see a lot of people immigrating to China which makes sense because even though some admire what they perceive as a better ability to get things done because of its authoritarian government, few willingly give up their freedom to benefit from such alleged authoritarian efficiency. Certainly few Muslims, gay people or women would look fondly on China’s attacks against Uyghurs, the LGBTQ community and the feminist movement and consequently aren’t clamoring to move there. Because of China’s oppressive government, many more migrants moved to the U.S. from 2015 – 2019 than to China as the chart below shows. However, the U.S. has been far more stingy in allowing people to move to the country in recent years, including under the Biden administration. Right when we’re in a competition with China, America is giving up on the one trait that has differentiated the country and that has benefited it more than any other: the ability to absorb people from all over the world to create a stronger, better America. Changing attitudes on immigration is one of the keys to America winning the competition with China.

