Debt is Different, Energy’s Future & the Wettest Countries
We’ve been hearing complaints about kids ever since we were one. From colleagues we hear complaints about millenials and what a pain they are. And yet, in our anecdotal experience, they seem much more mature, wise and put together than we ever were at their age. So while scanning the Internet stuck on a couch not wanting to wake the cat napping on our lap, we were pleased to come across a study backing up our anecdotal evidence. Apparently for the last 50 years scientists have been administering the “marshmallow test” where children are told if they wait 15 minutes, they will be given two treats. If they cannot handle being that patient, they only get one. This year’s testing results show, “…kids these day are better able to delay gratification than they were in the past, corresponding to a fifth of a standard deviation increase in ability per decade.” The scientists do not know why there has been an increase in the ability to delay gratification.* In one of our favorite sentences of 2017 they write, “Unlike IQ tests changes**, where schools and textbooks have routinely engaged in teaching to the test, we are unaware of any formal training in the marshmallow task for schools.” So even as we search for schools providing formal marshmallow training, gratified that our cat finally awoke, we note that not all debt is the same, examine coal usage forecasts and soak you with the wettest countries in the world. It’s this week’s International Need to Know, gratifying your interest in the world around us without delay.
*We guess the elimination of lead in the environment had some role to play.
** Generational increases in IQ scores, the so-called Flynn effect, have been going up for decades.The kids are smarter than us
Without further ado, here’s what you need to know.
All Debt is Not the Same
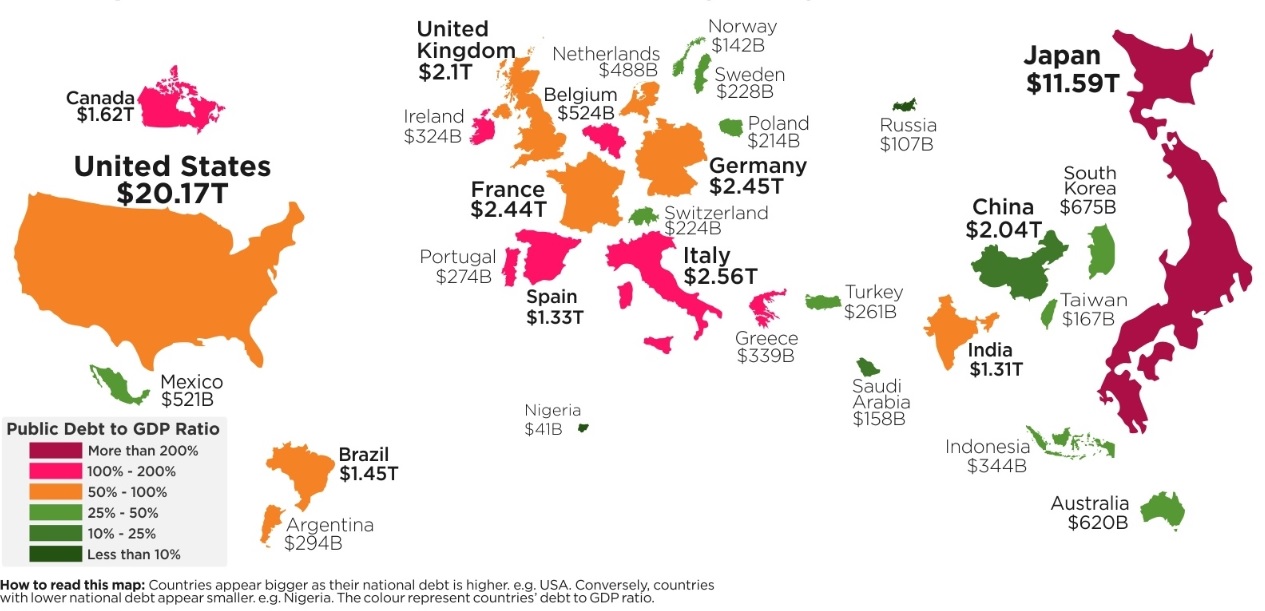
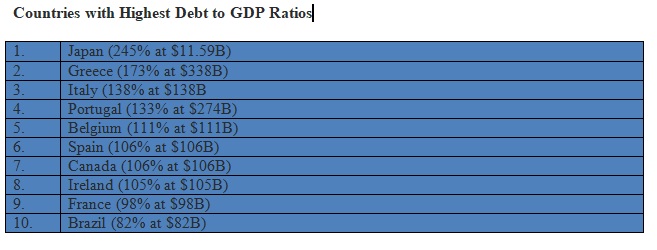
We’ve recently seen a variety of visual depictions of debt around the world. For example, howmuch.net displays sovereign debt in G20 and OECD countries in a nice easy to read map (see below). For your reading pleasure below the map we list the top ten countries with the worst debt to GDP ratios in the world. Japan continues to top that list. Not all debt is the same, however. People have been predicting Japan’s debt doom for nearly two decades now. So far Japan has avoided financial catastrophe, partly because most of the debt is owed to themselves, not to other countries. It’s also worth noting that at least in the last couple years, Japan’s debt has stabilized a bit, halting the rapid increase in debt of the last decade. Greece’s debt (they’re number 2) has obviously caused them problems because they owe other countries, have been bailed out repeatedly and the EU (Germany) have shown no inclination to forgive Greece’s debt. What about the flipside of high debt? Estonia, Saudi Arabia and Russia have some of the smaller ratios of debt to GDP. I’d be willing to buy an Estonian ETF but I’d be far more leery of doing so for Saudi Arabia and Russia. There is no Jeffersonian ideal of debt–it is not all created equal.
The Future, Mr. Gittes
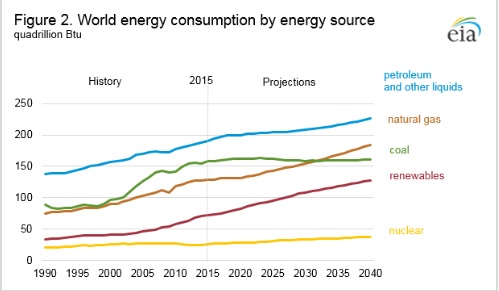
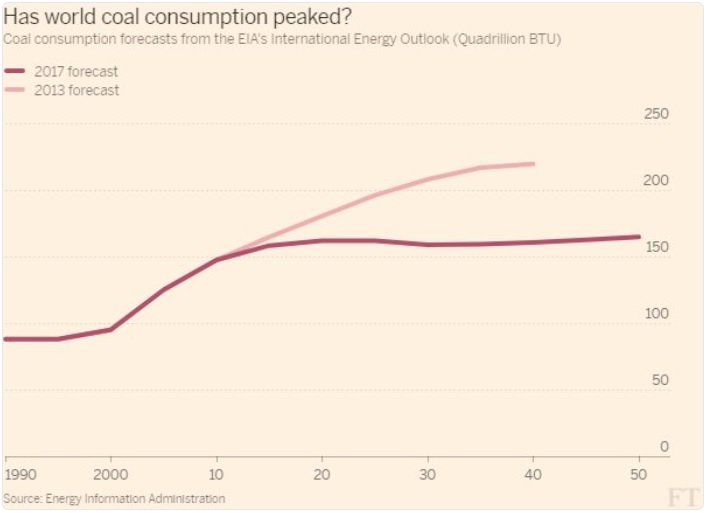
We continue to be less worried about America’s policy retreat on climate change measures than others (which is not to say we aren’t worried). Technological advances continue to point towards a cleaner future. The Energy Information Administration (EIA) recently released their 2017 International Energy Outlook. The report notes that world coal usage began levelling off in 2010. Petroleum usage continues to go up at a steady rate and natural gas at a somewhat faster one. Renewables, on the other hand, has seen a huge increase. That’s the past; the EIA also attempts to forecast the future. What’s strange is that the organization’s forecast basically maintains current trend slopes. This is generally a smart forecasting technique–things often don’t change much (inertia is the third or at worst fourth most powerful force in the universe). But when technology is improving rapidly as it is in the renewables sector, we expect the Energy Information Administration’s forecasts to be way off. As renewables continue exponential growth and storage problems are solved we expect coal usage to not just level off but decrease. In fact, compare EIA’s forecast from 2013 to today’s reality (see second chart below) where they radically overestimated growth in coal usage. Remind us in four years to investigate how today’s EIA forecast fares (when this missive will be delivered via augmented reality technology).
When the Rain Comes
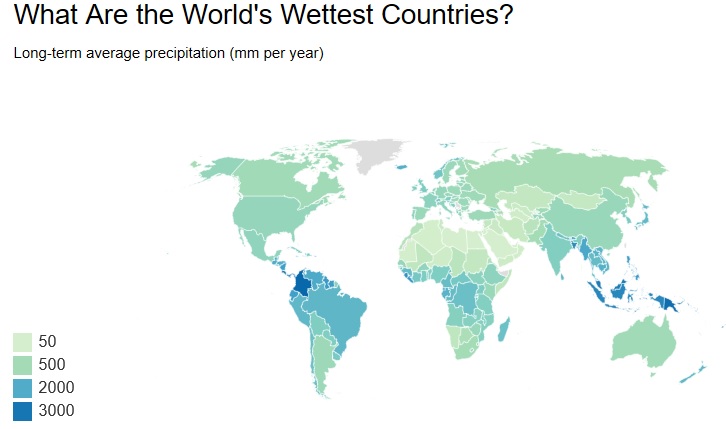
As you know, the worldwide headquarters of INTN is located in the great Pacific Northwest of the United States where we are known for our rain (we hope someday to open a satellite office in New Orleans). After a remarkably dry summer in which we saw nary a drop for more than two months, the advent of autumn has brought a renewal of our drizzly weather. As we wipe the mist from our glasses, in honor of the return of the rains, we present to you below the wettest countries in the world courtesy of the World Bank. To our surprise, Colombia is the wettest country in the world with 3,240 mm of rain on average per year. But Papua New Guinea is close behind, followed by Indonesia and Malaysia. Peruse at your leisure as we prepare a shipment of bumbershoots to these countries.

Leave a Reply
Want to join the discussion?Feel free to contribute!