Mistake Were Made, Health Care Costs and 3 Possibly Related Graphs
Years ago an employee came into our office upset about something we did. They were mid-way through a rant about our screw-up when we politely interrupted them and said they were right, we had made a mistake, and we apologized. No weasel words, no attempting to explain anything away–we flat out said we were wrong and shouldn’t have done it. Our employee was not prepared for our admission of error; in fact they were completely taken aback. And they were also very gratified and quickly became a happy and productive worker and human again. We learned an important lesson: saying you’re sorry when you screw up is not only the right thing to do, it’s highly effective. So, after a year of writing INTN, we pause a moment to point out a few of the mistakes we have made these last 12 months. We do not promise to be error free next year but do pledge to point out our failings should we discover them. It’s this week’s International Need to Know, offering apologies even as celebrities worldwide huddle in fall-out shelters desperately trying to outlast the final few days of 2016.
Without further ado, here’s where we made mistakes, plus world health care costs and three maybe related graphs.
Mistakes Were Made
- We go down as U.S. oil usage goes up
In one of our earliest posts of the year we postulated that we had reached peak oil usage in the United States and that in a decade we would reach peak oil usage in the world. We stand by this prediction but we should note that oil usage in the U.S. increased last year to 19.4 barrels per day. That is still less oil used than at the peak in 2003 but certainly not a good harbinger of things to come. Numbers are still being crunched for 2016 but oil consumption likely increased again, but probably still not above the 2003 peak (we write with fingers crossed–not an easy thing to do, by the way).
- Mucking up China’s Middle Class
- Tripped Up by the Straddle Bus
- Bad Brexit Predictor
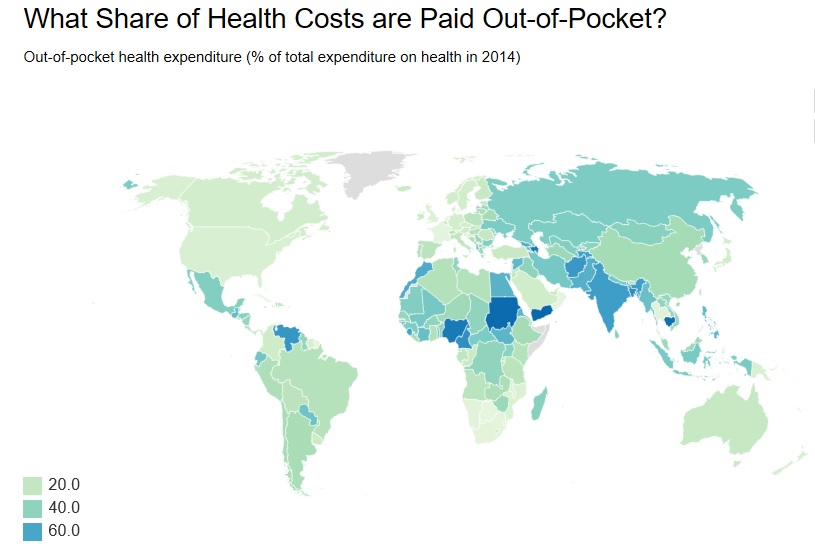
Paying for our Health
Health care is likely to be a hot issue in the United States next year. According to the World Bank, about 11% of U.S. health care funding is out of pocket expenditures, that is, money directly paid by the individual patient. The percentage of U.S. health care spending that is out of pocket is relatively low compared to the rest of the world. Yemen and Sudan have the largest percentage of out of pocket expenditures at 76.4% and 75.5% respectively. Much of Europe is relatively low though many of the countries, including Germany, have a higher out of pocket expenditure than the U.S. China is fairly high at 31%. Here’s to a healthy and happy new year.
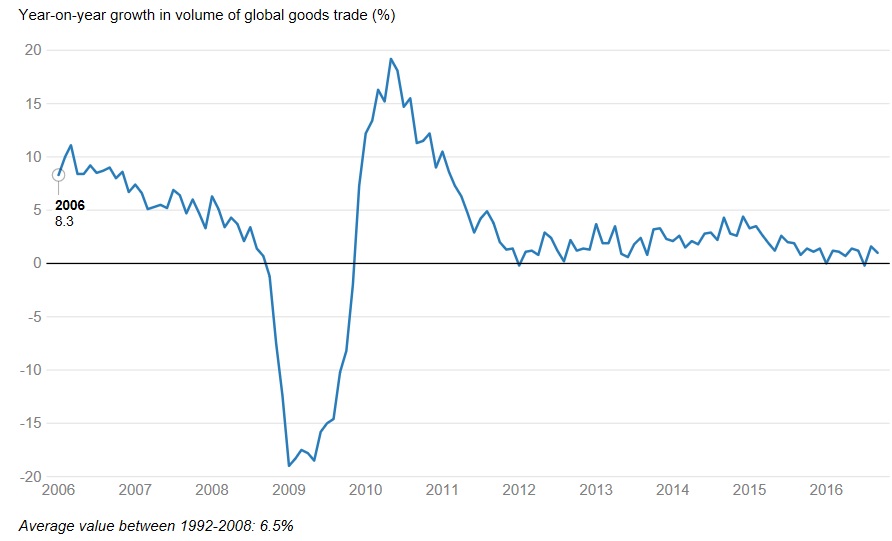
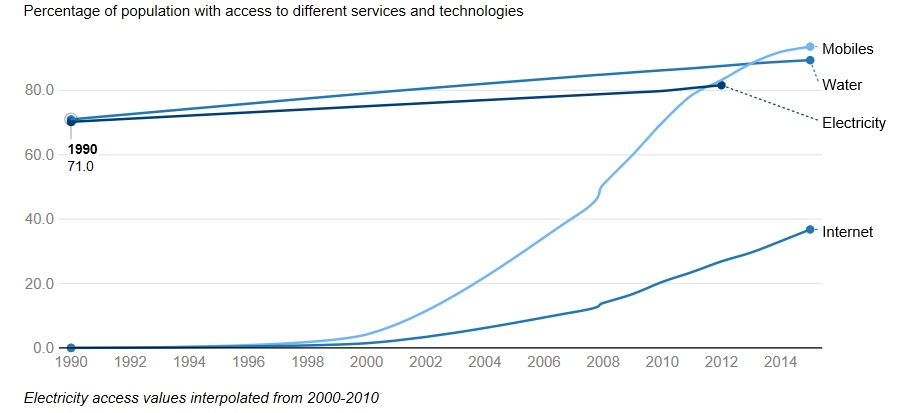
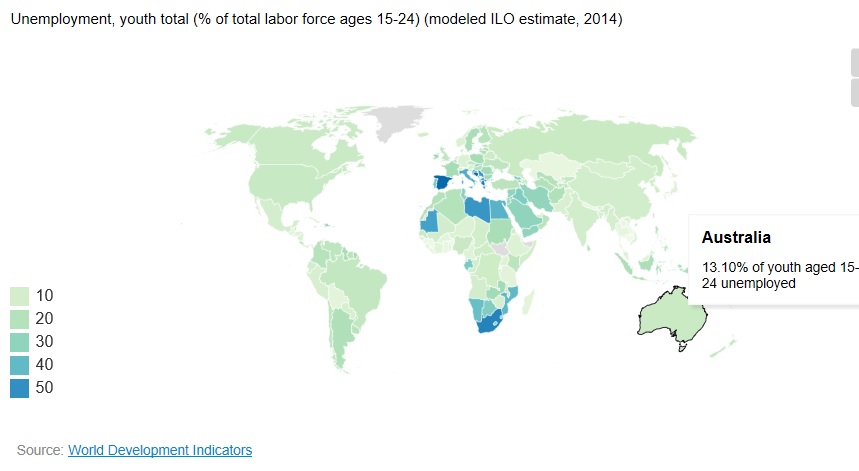
Three Graphs to Prepare for 2017
With no comment but rest assured we will discuss these perhaps related graphs sometime next year (one must tease and promo 2017), here are three graphs to contemplate while drinking your glass of champagne and toasting in the new year. May it be healthy, happy, prosperous and full of wisdom.
Leave a Reply
Want to join the discussion?Feel free to contribute!