Back before the current Russian shenanigans, for work we traveled to Russia.* The Russian Far East, to be precise, not too distant from Siberia. In the middle of Winter. It was so cold we were unable to walk outside wearing our then metal-framed glasses because they would stick to our face. But that’s not the coldest we’ve ever been in our life. No, that would be on opening day of the baseball season in Seattle at Safeco Field, back in 2000. Granted we had not dressed adequately for the occasion, but still, it was Russian cold in the stadium that day. So it is with our usual false spring baseball optimism (it’s been 17 years since the Mariners have made the playoffs but this time of spring we pretend this is the year) that we prepare to attend tonight’s opening game of the Mariners, mixed with some practical wisdom of wearing at least four, maybe five, layers. We will enjoy the annual ritual of the players running onto the field, the inspiration of the child suffering a life threatening disease who gets to run around the bases and the well-earned nostalgia of hearing the recorded voice of the late, great Dave Niehaus. But we hope to enjoy it all while not freezing like a Russian winter. Meanwhile, we warm you up with the Complexity Index, throw heat on China trade surpluses and blow up the trend of ever bigger cities. It’s this week’s International Need to Know, never throwing bean balls but sometimes a stray slider of international news and data.
| Macklemore and Ryan Lewis – My Oh My (Officia… |
 |
| 123332 likes |
23997607 views |
*We are amused we will no longer get to enjoy the 1950s décor and atmosphere of the Russian Consulate in Seattle, where we had a number of memorable meetings.
Without further ado, here’s what you need to know.
We Simply Offer the Complexity Index
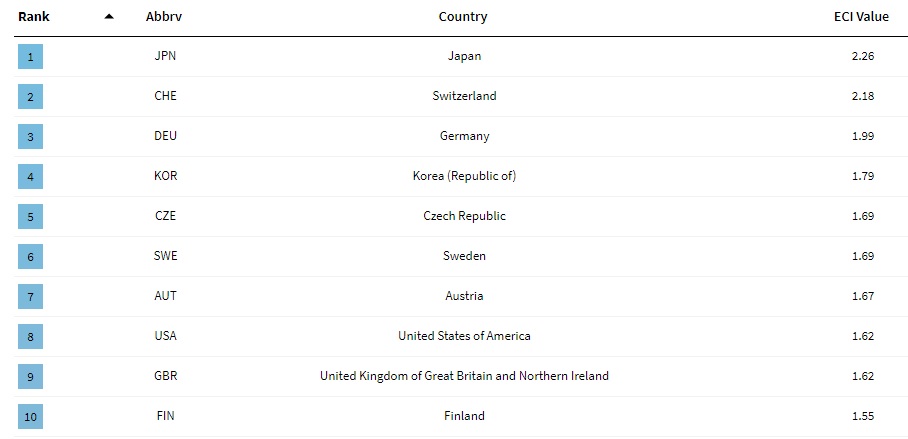
We’re a sucker for an index, both the kind found at the end of books (how many times was Churchill referenced in that World War I book?) and the economic ones. So we were intrigued when we recently stumbled upon the Economic Complexity Index, which attempts to measure how complex (i.e. diverse) a country’s economy is. It does so by measuring how many different products and services a country exports and comparing that to how many other countries make those particular products and services. Places like Switzerland, Japan and the U.S., which produce a diversity of products and services and export them, are higher up on the Index, while countries such as Zimbabwe, which make very few products, rank low on the index. Below are the top ten countries for 2016. The Harvard Center notes that China has regressed in recent years and India has moved up the rankings, which they believe portends slower growth in China, and increased growth in India. We’ve already noted for other reasons that China’s growth will be slower in the future, whether official statistics show this or not. Here is perhaps more evidence.
Deficits, Technology, Today, Tomorrow,
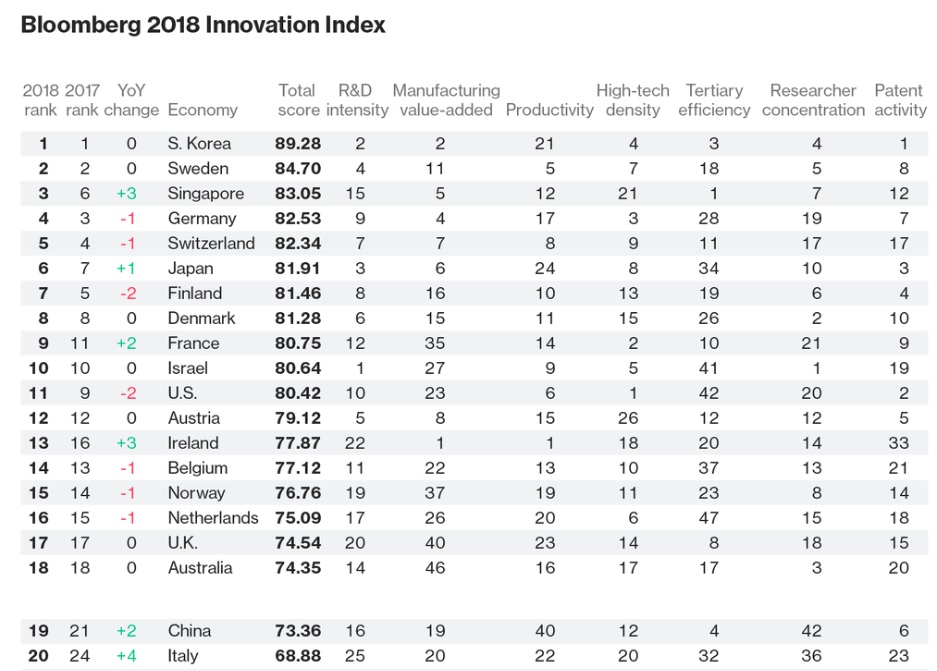
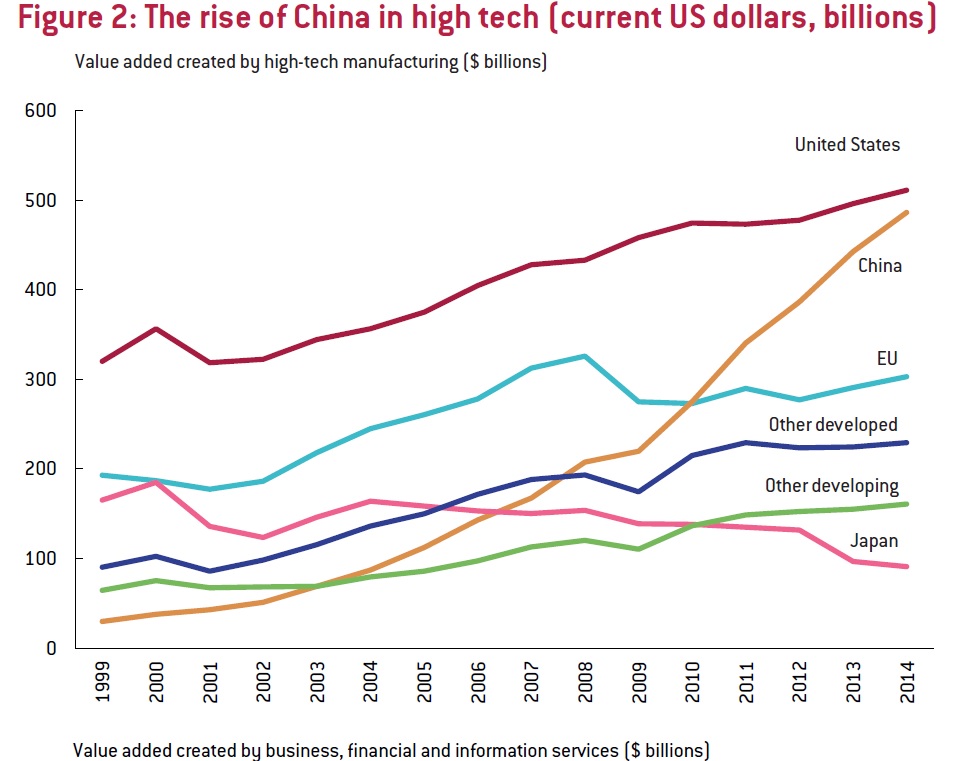
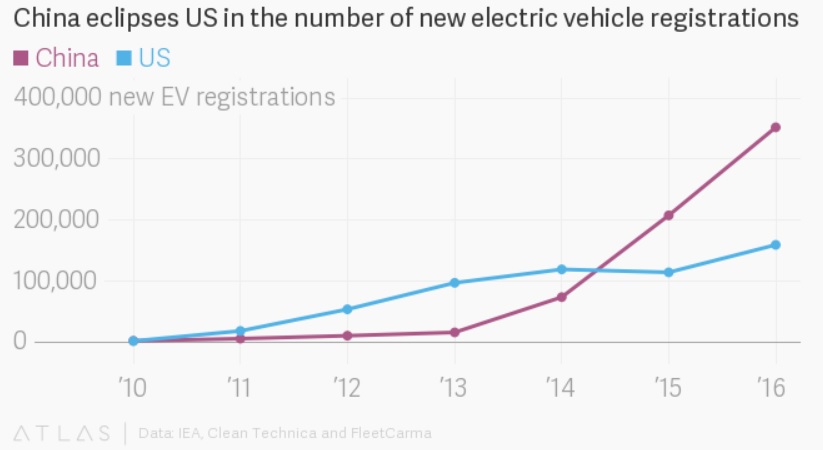
We have long called for a Sabermetrics revolution for international trade statistics. Our officials use the equivalent of ERA and batting average to drive trade policy debates (For those not into baseball, those were common, but we now know lousy, measurements of how good a player is). Case in point as Allison Schrager pointed out last week, the China – U.S. trade deficit is really much less than the officially stated $375 billion. Schrager cites the classic example of the iPhone to prove her point. The entire $900 of an iPhone is counted to the trade deficit with China. But, Schrager notes that more than a third of the iPhone’s components are made outside of China in other Asian countries. The real trade deficit with China is similarly probably a third less than advertised. But today is not tomorrow. China is becoming more innovative, creating more technology itself and doing more value added work each year (see the chart below). The biggest challenge with China is not the trade deficit itself but China’s continued protection of domestic markets. Among the reasons Chinese companies dominate in their domestic market is because China continues mercantilist policies. On the other hand, much of the U.S.’s success in innovation is due to immigrants, including and especially those from China. According to Bloomberg, “there are more Chinese engineers working on artificial intelligence at U.S. tech companies than in all of China.”* So America’s trade deficit with China is smaller than official statistics, but the current American animus to immigrants could mean in the future the official trade deficit matches reality. Post-modern politics is constructed with steel ironies and iron fallacies.
*Does that mean America’s intelligence is artificial? No! We’re a nation of immigrants
Bright Lights, Big City, Government Fiat
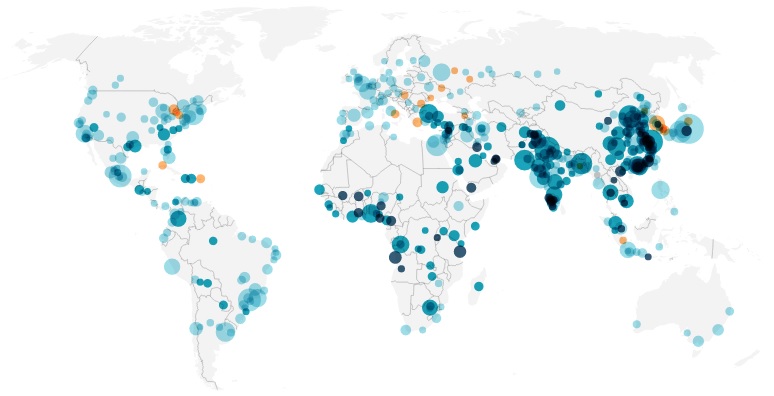
As you know, as of 2007, more people live in urban areas than rural ones. That trend continues with cities continuing to grow rapidly. So what were the fastest growing cities between 2000 and 2016? According to the Visual Capitalist, in India, “the fastest growing cities are in the south, where there are at least 10 large cities that have roughly doubled in size.” In South America, Bogota, Colombia has grown the fastest. In Africa, Lagos, Nigeria has doubled to nearly 14 million people. And then there’s China. Lots of cities in China’s coastal regions have doubled in size during that time period. Xiamen, where a few years ago we drank too much baiju with the deputy mayor, has tripled in size. Experts predict more and more mega cities emerging over the next 50 years. Are there any technological and cultural events that will reverse that trend? How about government fiat? China is purposefully trying to cap the populations of two of their largest cities, Beijing and Shanghai, according to the Financial Times. And, in fact, Beijing’s population shrank slightly last year. Whether they are successful in that new policy will help determine just how accurate the prediction of larger and larger cities is.





.jpg)
.jpg)
