IMF Explanations of Declining Labor, Are We Wrong about Chinese GDP, Where the Money is Going
It is all about the hunt, the seeking, the thrill of the chase in this little world of ours. And so after many years, countless hours of research, many false leads, we are ecstatic to announce that we have finally found a bialy worth its name here in the Pacific Northwest, the home of the worldwide headquarters of International Need to Know. Wait, what is a bialy you ask? Ahh, a bialy is like a bagel but a thousands times better–baked rather than boiled and rather than a hole, the middle contains onions or garlic. We sampled bialys as a child visiting family in New York and continued to enjoy them over the years whenever we were in the big city. But outside of New York they are hard to find and almost impossible in the Seattle area. A few local bakeries carry something they claim are bialys but they are virtually unrecognizable from the real thing. But then our friend (the now sainted) Pete Gladhart handed us a bialy from The Bagelry in Bellingham, Washington, and as we bit into it the skies opened and glory (and taste) rained down upon the land. For this was a bialy almost as good as Kossar’s on the Lower Eastside of Manhattan. Unfortunately, Bellingham is a long drive from our Seattle headquarters so as we make plans to develop a bialy food truck with a secret method of replicating New York bialys we bring you an explanation for the decline in labor’s share of income, ask whether we’ve been wrong about China’s GDP and tell you where the money is going. It’s this week’s International Need to Know, the new, better, more honest, non-harassing, no-spin zone of international news.
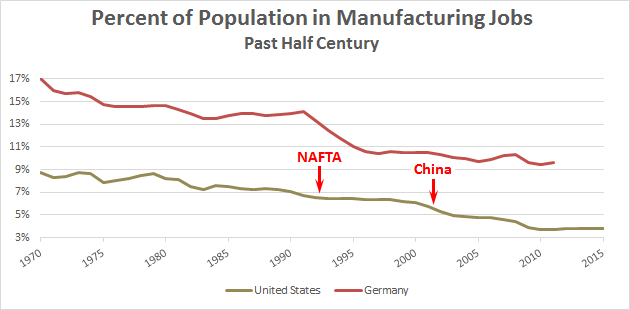
IMF-Splaining of Decline in Labor Share of Income
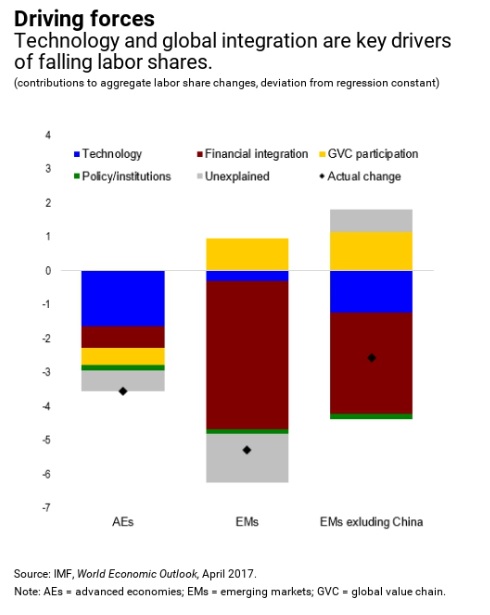
Earlier this year we pointed out that the global share of corporate income has been decreasing since the early 1980s, noting “it’s not just in developed countries like the U.S., Germany and Japan–China is seeing the same trend.” We did not hazard an explanation for this trend but just in time for kids and anarchists to dance around the May Day Pole, the International Monetary Fund (IMF) does, arguing that “this trend is driven by rapid progress in technology and global integration.” The reasons for the trend differ by type of economy. In advanced economies, the IMF asserts, “half of the decline in labor shares can be traced to the impact of technology. The decline was driven by a combination of rapid progress in information and telecommunication technology, and a high share of occupations that could be easily be automated.” In emerging markets, on the other hand, the IMF states, “We find that global integration, and more specifically participation in global value chains, was the key driver of declines in labor shares in emerging markets.” The IMF’s claim is that such integration is “shifting the production in emerging markets and developing economies towards more capital-intensive activities.” We’re not sure we buy these explanations for the decline in labor’s share of income but since we raised the issue we offer up the IMF’s ideas for the cause of this trend.
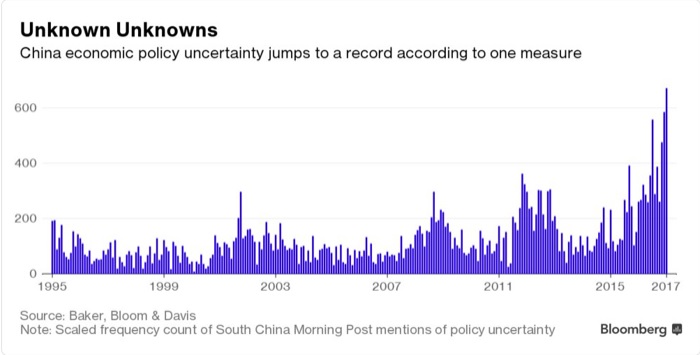
Are We Wrong About Chinese GDP?
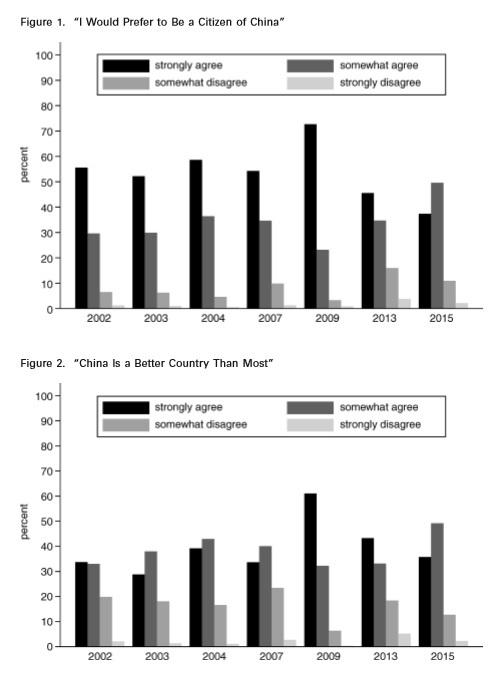
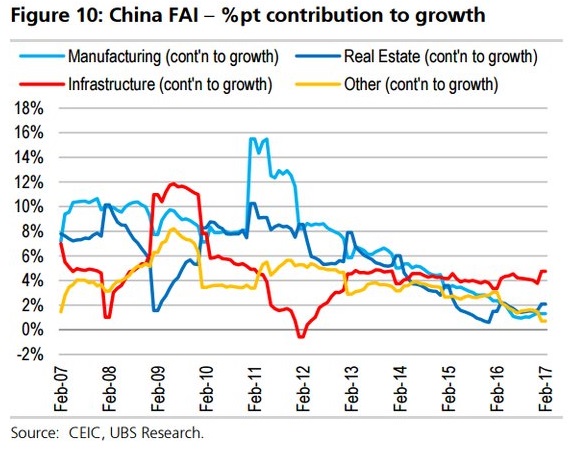
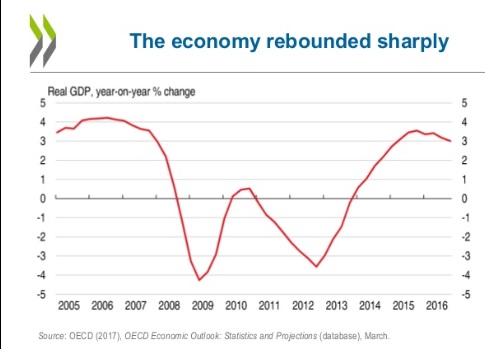
On more than one occasion we have joked about the validity of official Chinese government statistics on GDP growth, asserting they are higher than the actual growth of the economy. But is the joke on us? A new economic paper tells us we are wrong—not that the government’s statistics are correct but that the official GDP figure is actually undercounting GDP?!!! The method these three economists used was to count satellite-recorded nighttime lights, something that cannot be manipulated the way GDP statistics can be. To vastly oversimplify, these economists found that they could correlate the increase in these lights to increases in GDP and to other variables which simulate economic growth such as electricity use, freight volume and bank loans. Using the nighttime lights variable they calculate that Chinese GDP figures are actually higher than what was reported by the government. The economists used nighttime light data from 2004 to 2013 before many of us thought China was having economic difficulties. But the paper also examined late 2015 data: ” We find that GDP growth in 2015 Q4, a time when the financial press was awash with stories about a hard landing of the Chinese economy, is somewhat higher, but quite close to the officially reported rate, with a 95% confidence interval…” We are curious what nighttime lights show for 2016 GDP growth. This paper does note that the growth seems to be driven by credit which could foretell an economic stall when this credit growth is removed. While we await others analysis of this economic paper that is upending our beliefs, we file it in our increasingly large file labeled “China is complicated.”
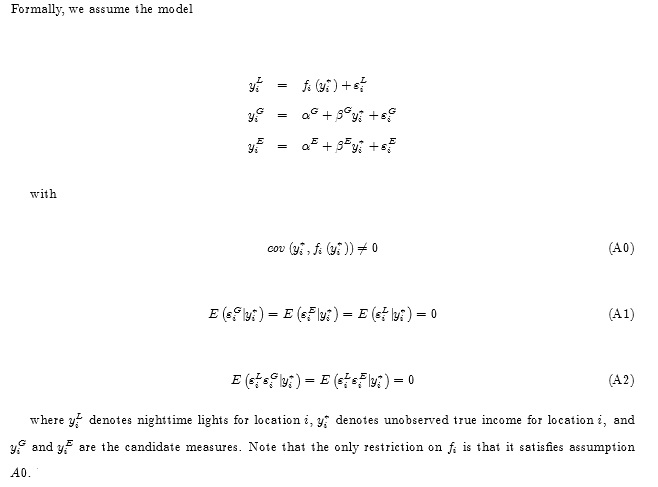
China’s real GDP Growth. You do the math! Or, maybe not, the math the economists used is a bit complicated:
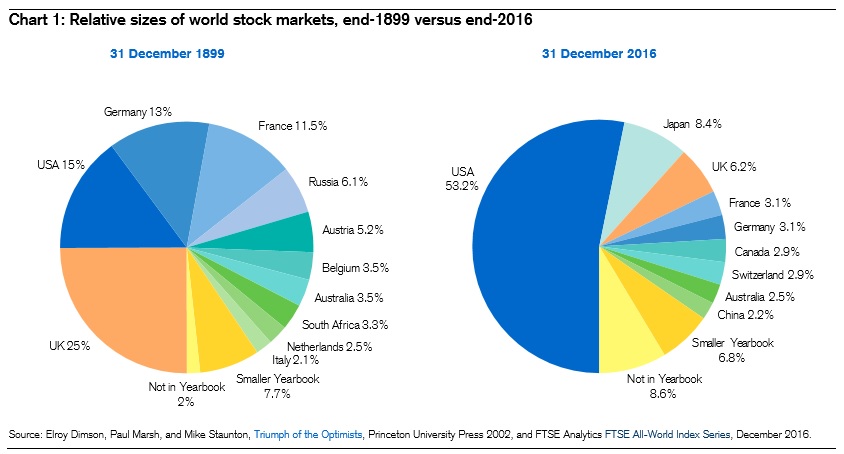
Where the Money is Going
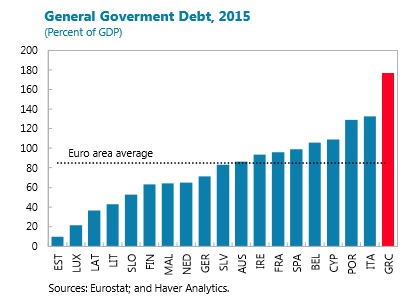
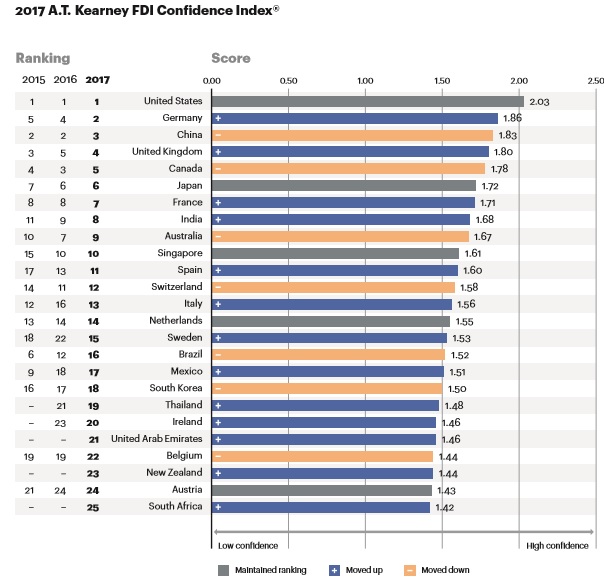
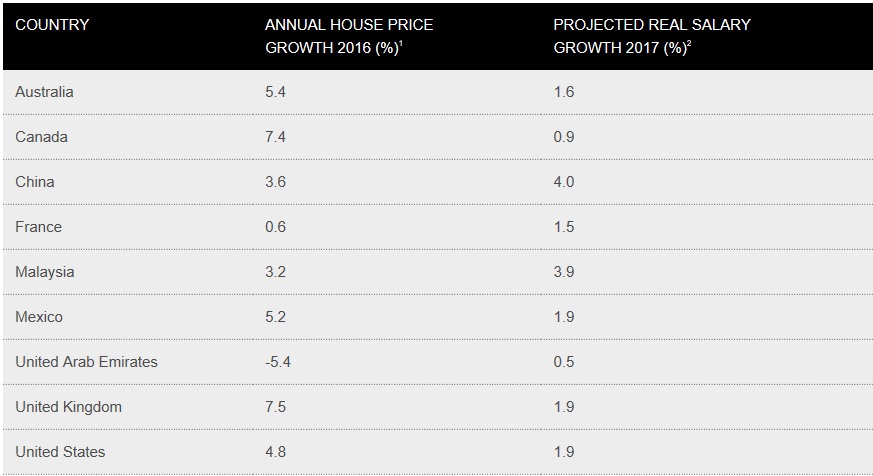
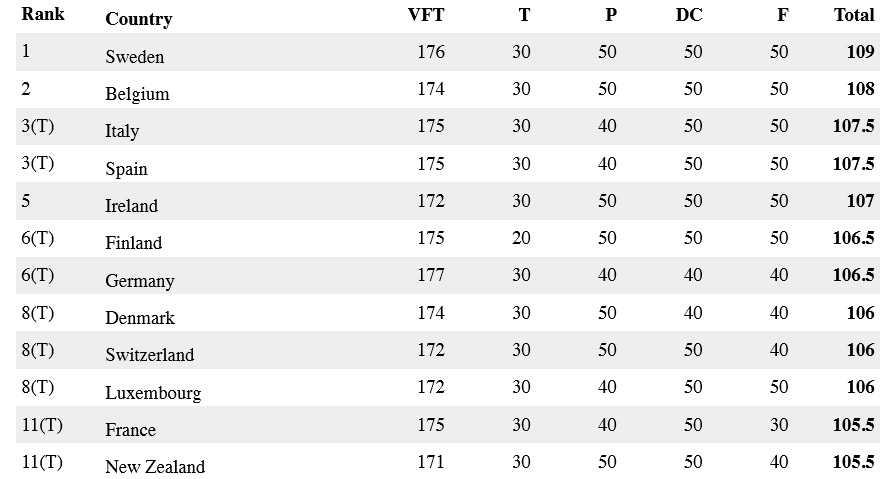
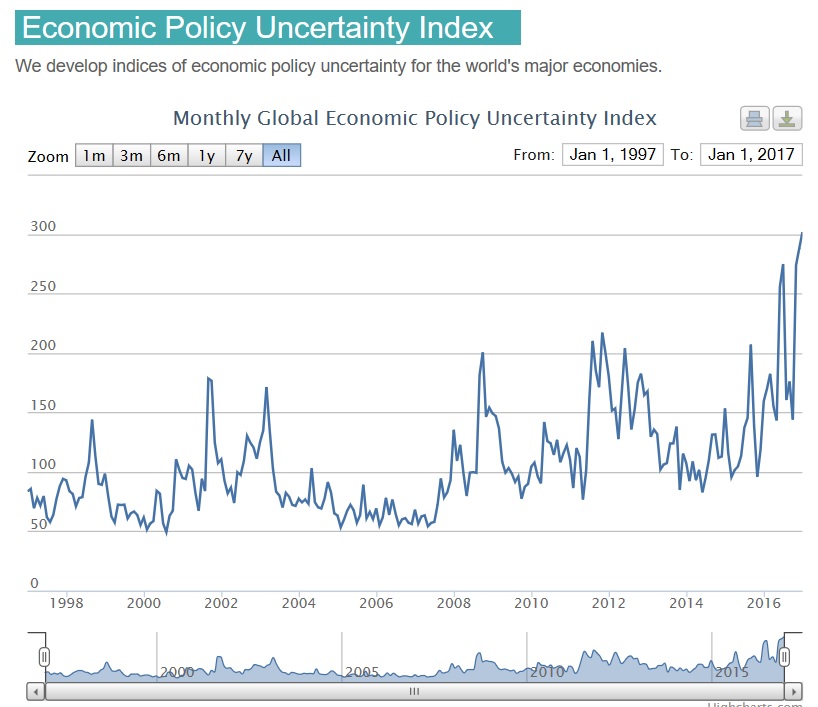
The world seems to be more volatile than usual, at least if you scan the headlines. But even in the midst of the constant churning, money continues to flow around the world. In which places do investors currently have the most confidence? The 2017 A.T. Kearney Foreign Direct Investment Confidence Index tells us the United States is number one for the fifth year in a row. In fact, Canada, coming in at number five, makes North America an investment destination powerhouse. Rounding out the top five are Germany, which rose to second as China fell to third (but the nighttime lights?) and the United Kingdom comes in fourth. The folks at A.T. Kearney were surprised that the UK did so well given the uncertainty of Brexit. A.T. Kearney explains the the U.K.’s investment destination resilience, by noting that, “U.K. Prime Minister Theresa May has promised they will emerge as a ‘Global Britain,’ one with fewer cumbersome EU-mandated regulations…” We still hope to do a deep dive into Brexit in the coming weeks–in fact, we are assembling our mask and oxygen tanks as we type.

.jpg)
.jpg)