Shattering Authoritarian Myths, Clean Saudi Arabia and Higher Education Levels Around the World

We are not one to believe in omens, fate or inevitabilities. When something bad happens to someone and they rationalize the catastrophe by telling us bad things happen for a reason, we wonder if it was the reason that was bad. Others tell us when catastrophe strikes that it is all part of the grand plan, which causes us to want to have a word with whomever is in charge. But when we were cleaning the photos off our phone the other day we came across the image below that we took late in the summer while walking to a Seattle Mariners baseball game. And we wondered if it was not an omen perhaps it was at least a warning of the coming political cataclysms. So even as we vow never to litter internationally, domestically or even galactically, we explore the myth of the successful authoritarian, examine a clean Saudi Arabia and ponder higher education levels around the world. It’s this week’s International Need to Know, a refugee to reason in a complicated world.


Without further ado, here’s what you need to know.

Shackle the Unfree Thoughts

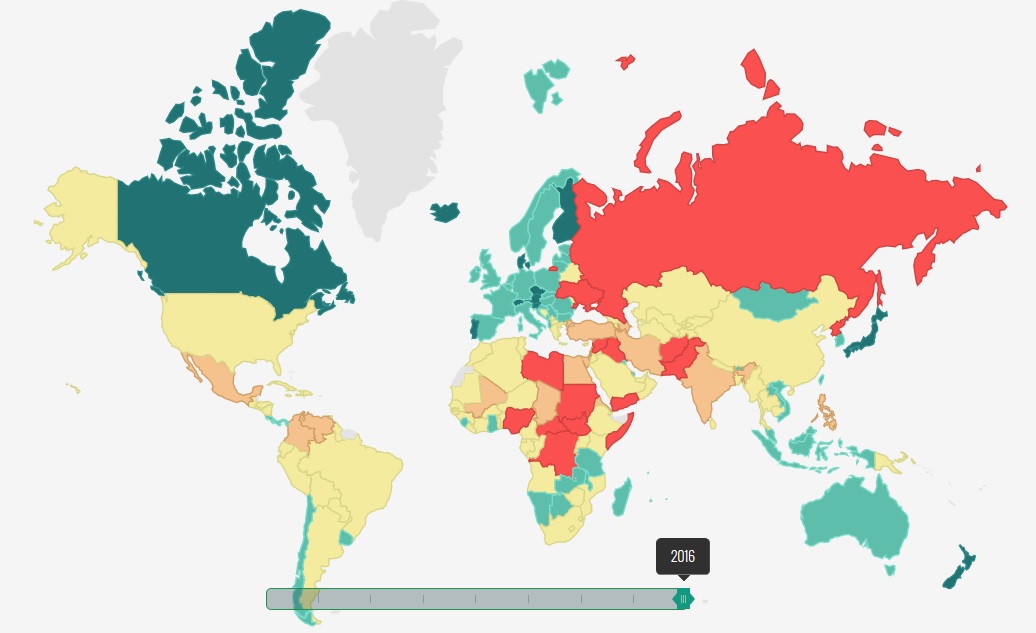
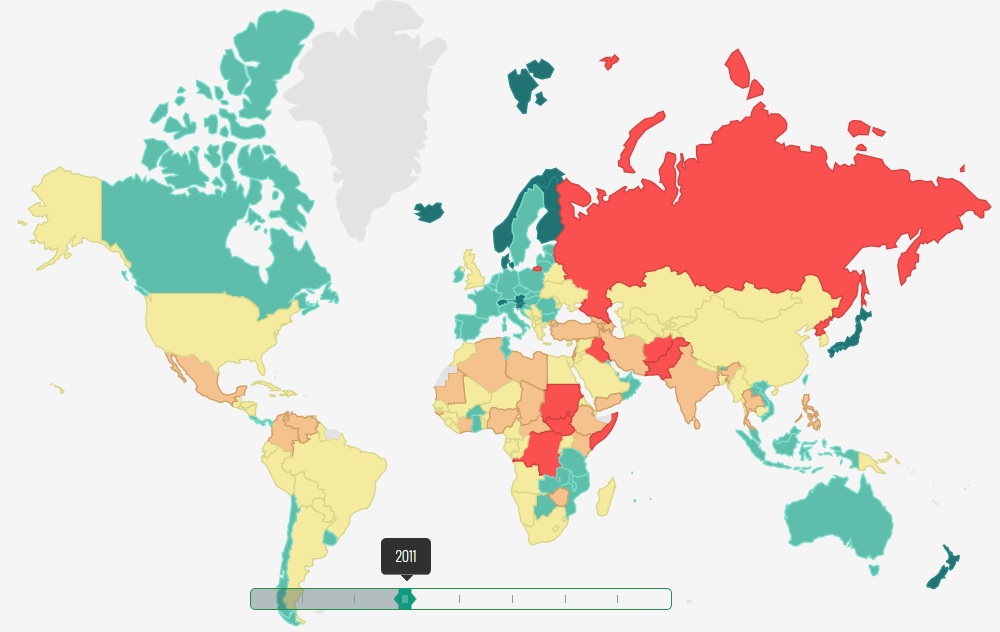
As we noted last year, millennials support for democracy is lower than other age groups and their fondness for authoritarianism is also greater. And, over the last ten years, with the economic success of China, we’ve heard more and more people express the sentiment that democracies can’t be as successful economically because of all the process and the inability to get things done. We’re all for making ourselves more efficient (see our story on Europe’s more cost-efficient infrastructure, for example), but it is time for a dose of reality on what kinds of countries are more successful. The World Bank’s Doing Business Survey, which ranks countries on how easy it is to do business in them, finds that by far the most successful countries are free. Further, the bottom performers are mostly unfree. Don’t like the Doing Business Survey? Okay, check out the top 20 countries ranked by GDP per capita. Almost every single one of them is a free country. So let’s stop the pining for authoritarianism and concentrate on improving our democracies. 


A Clean Saudi Arabia

Even as the United States may pull back on climate change fighting efforts, other countries are full steam ahead (powered by renewables, of course), including Saudi Arabia. Fortune Magazine tells us that “Saudi Arabia will launch a renewable energy program in the coming weeks that is expected to involve investment of between $30 billion and $50 billion by 2023, Energy Minister Khalid al-Falih said on Monday.” Currently the country produces less than 1 percent of their energy from renewable sources but they plan on changing that, especially since energy demand in the country is growing at an 8% rate. They are also hoping to team up with other countries in the region such as Yemen, Egypt and Jordan in the push for renewable energy. We note that one of the forms of renewable energy Saudi Arabia is exploring is nuclear, which is likely to create angst in some quarters. They are exploring partnering with China on the nuclear energy initiative. The world, it’s a changing fast.

Primarily Secondarily

We’re involved with a project that has us reading about and researching higher education which led us to discover that Korea has the highest percentage of their population with a postsecondary degree. This is helpful because more and more of the jobs in the future are going to require such an education level (or a robot—we need our people to get smarter and our robots dumber. If it weren’t for the Flynn Effect, I’d swear the opposite is happening). Canada is second followed by mighty Luxembourg and the fighting Irish. Italy, which we are increasingly worried about (remember our warnings about GDP and banking), brings up the rear. 


Canada Compared to Venezuela, China a leader on free trade (??!!) and the world’s third most important graph

New wood floors are being installed here at INTN’s global headquarters. This has wreaked havoc on house, computer and cats, the last of whom are most upset by the upheaval. Willow hides in the basement while the ever sociable Putter tries to hang out with the workers, but is apparently overcome with anxiety causing the poor feline to vomit repeatedly. Fortunately so far he has restricted his regurgitations to defacing the old floors though we tremble at what is to come. In the midst of it all, as we attempted to write this missive among saws, hammers and other noise, two salesmen came to our door wanting to talk to us about switching over to their cable company. When we attempted to explain to them this was not a good time (this should have been abundantly evident by wood, laborers and the general construction mess surrounding them on the front porch), they insisted their information was vitally important and we must talk to them right that minute. It was then that we wished we had trained Putter to vomit on cable company salesmen. So even as we call in the cat whisperer for expert advice, we compare Canada, Venezuela and iPhones, snicker at the idea of China as the leader of free trade and present the world’s third most important graph. It’s this week’s International Need to Know, purring with world information intended to scratch your fancy. 

Without further ado, here’s what you need to know.

Canada, Venezuela and iPhones

Last year we took to task a news organization for saying Venezuela’s economic problems are due to low oil prices. Canada is a great example of what we’re talking about. Canada, like Venezuela, is also a big oil exporter and certainly its economy suffered when oil tanked in 2014. But, because Canada has economic policies that are not crazy, their economy did not and would not suffer like Venezuela’s. In fact, Canada’s business confidence is at its highest level since before the oil crash and its economy added the most number of jobs since 2012. Meanwhile, it costs $98,000 to buy an iPhone in Venezuela. Canada is also preparing for President Trump by naming Chrystia Freeland* to be their new Foreign Minister. She led the charge in getting the Canada-EU free trade pact approved. With a good chance NAFTA will be torn up by Trump, she would have chief responsibility for negotiating the new pact. By the way, NAFTA was essentially an addendum to the U.S. – Canada Free Trade Agreement which would still be in force even if the new Trump Administration ends NAFTA. And when we talked with the Canadian government recently, the official indicated it’s probably time to update the agreement anyway. After all, many industries didn’t even exist when that free trade agreement was approved. Venezuela meanwhile is in no position to negotiate free trade agreements or much of anything else. It’s not about the oil.

*It’s worth noting that Freeland, of Ukrainian heritage, has been banned from traveling to Russia for her anti-Putin views.


China’s the Leader of Free Trade?

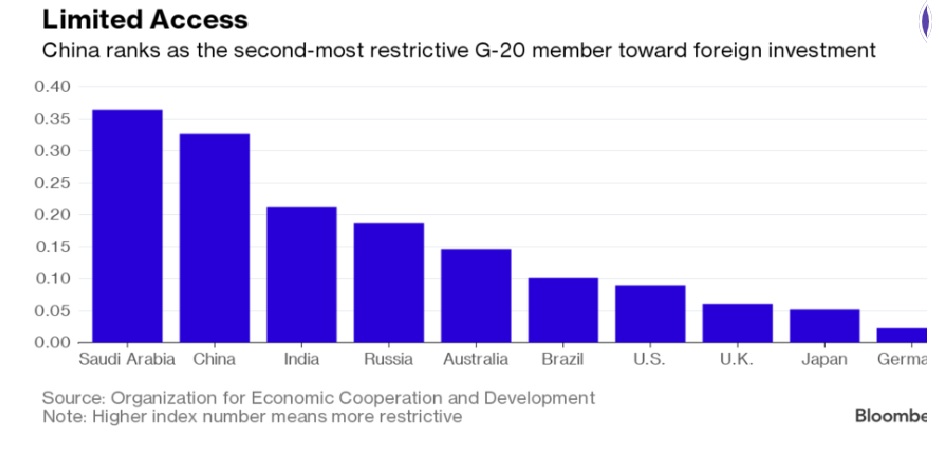
After his speech at Davos, there’s been lots of talk about China’s President Xi Jinping leading the world’s free trade movement since the U.S. is abandoning that role. President Xi certainly talked about the importance of free trade in his speech but his country doesn’t walk it. In fact, a good argument could be made that China is the most protectionist country in the world, or at least vies for the title with India. The “Global Mercantilist Index” ranks those two countries one and two (see chart below) for most protectionist. Even if we look at simple tariff rates, never mind all the non-tariff barriers, China is at best middle of the pack, behind such free trade stalwarts as Belarus, Nicaragua and Moldova. Or, look at China’s new cybersecurity law which will go into effect on June 1st of this year. The new law “imposes new security and data protection obligations on network operators, puts restrictions on transfers of data outside China and introduces new restrictions on critical network and cybersecurity products.” More than one China expert we’ve spoken with notes that the law is designed to bolster China’s local industry and cut out foreign companies. The world is changing but not so much that China is really the leader of the world’s free trade movement. That’s being led by a lovely couple in a small town in Chile out of their third-story apartment.

Rankings of Protectionist Countries


World’s Third Most Important Graph 

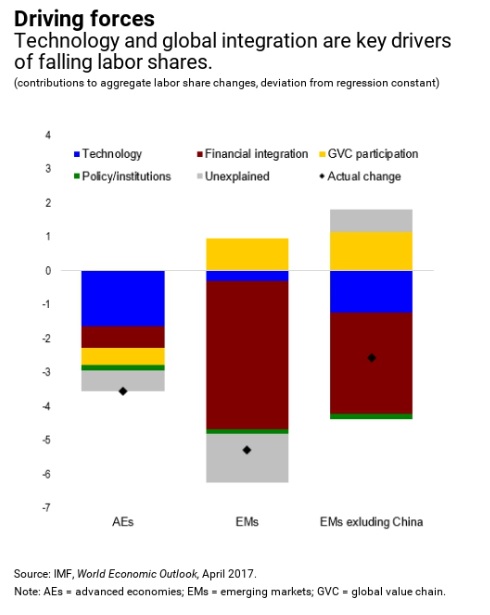
Last year we presented the world’s fifth most important graph. Today, we present the third, which arguably, like a college football BCS playoff argument, could be ranked higher. Either way, peer below and gaze on the factor that is driving so much of what is happening in the world today, including in the United States–the global labor share of corporate production has been decreasing since the early 1980s. Two economists at the University of Chicago crunched the data and found “of the 59 countries with at least 15 years of data between 1975 and 2012, 42 exhibited downward trends in their labor shares.”  Oh, and by the way, it’s not just in developed countries like the U.S., Germany and Japan–China is seeing the same trend (see second graph below).  Trends end eventually, as the Seattle Seahawks painfully learned this season. Whither and when this one is a crucial question for our future.


Auto jobs, Solar in the Developing World and Ending Malaria

Our world is awash in challenges, from global health problems to climate change to economic hardship. Fortunately, there are very smart people working on these problems at some of our finest institutions. For example, two scientists at MIT, noting that people felt 2016 was an especially bad year for celebrity deaths, decided to calculate whether it really was such a bad year and whether coming years will bring even proportionately more celebrity deaths. At the link you can see all the math, charts and graphs but the bottom line is the number of famous people dying each year is increasing because each year there are more famous people than there used to be. 2016 seems particularly bad because there were more “especially famous” kicking the bucket.  But rest assured, the MIT researchers tell us, we do not need to worry about more and more famous people passing away each year because “we may soon reach a time when what will limit the number of famous people we produce will no longer be our means of communication, but our limited attention and human memory.” Even as we forget the name of that singer who died last week we remember to tell you of automobile jobs around the world, the use of solar in developing countries and great progress on malaria. It’s this week’s International Need to Know, working for our star on the Hollywood Walk of Fame one data chart at a time. 

Auto Jobs

Automobile manufacturers have been in the news recently as people assert where cars should and should not be built. This got us to thinking about which countries manufacturer the most number of cars and which countries have the most automobile industry workers. These two lists are very different with the exception of China and the U.S. claiming the top two spots on both (see table below). Russia has the fourth-largest number of auto workers even though it’s not even in the top ten for auto production (Putin’s regime ranks only 14th in production). Mexico is the seventh-largest producer of cars but builds these autos with relatively little labor, ranking only 17th in number of workers. We expect the number of auto workers to fall in the coming years as such work continues to be automated. And what will be the effect on the number of autos produced with the advent of self-driving cars and the continued rise of ride sharing? Will China continue to have 1.6 million auto workers? Will Mexico have a larger market share of cars produced than the U.S.? Will it matter in terms of number of workers? We need Marty McFly’s DeLorean to find out, or, alas, merely wait a few years.


Let’s Get Lit

In writing in this space about the ongoing solar power revolution which is on pace to take over energy generation in the world over the next 15 years, we did not concentrate on those who do not have electricity. Not to beat up on ourselves since we’re certain there’s plenty of people eager to do so themselves, but that’s a lot of people not to concentrate on. There are still about 1.2 billion people in the world without electricity, most of whom are in Sub-Saharan Africa but also 263 million people in India remain electricity-less. Fortunately, there’s also a big effort to provide these people electricity, and most of that will be in the form of solar. Currently those without electricity often get their power and heat by burning biomass which is bad for their health and bad for the environment. So this new age of solar power is not only a game changer for how we get our power but also for providing power for those who have none at all. 


The Continuing Campaign Against Despair 

In our continuing campaign to remind ourselves and the world at large that we live in the most peaceful, prosperous, healthy time in history, below we display a graph showing the remarkable decrease in global malaria deaths over the last 15 years. Malaria deaths during that period fell by 66% among all age groups and by 71% among children. And there are efforts to make even more significant progress in the coming years, including progress on a new vaccine. We jump into cesspools of doom and gloom with the best of them but today and most days we can dry ourselves off with towels of good news, including the news of great progress on malaria.


China’s bitcoin, Acid Improvements and European Infrastructure

Perhaps it’s due to our having a cold for over a month (a viral metaphor for the late, lamented 2016?) but we’ve been obsessed with the video of Patti Smith performing Bob Dylan’s A Hard Rain’s Gonna Fall at December’s Nobel Prize Ceremony. It’s a powerful performance made even more so when Smith falters with the lyrics, a moment of great humanity as she is picked up by the audience and the musicians. It was perhaps a moment that illustrated the best of humans. And, of course, the song itself is pure brilliance and a wonderful testament for why the Nobel Committee chose Dylan in the first place. And then we watched the video again…and again…and again…We watched it probably 30 times over a three day stretch and slowly it dawned on us that the performance, the setting, the people (kings and queens and elites of every stripe), the song, the temporal distance from the writing of the song, the ages of performer and audience are all like a great painting from one of the masters, depicting where we are, where we have arrived, in this new era as the old one and its post-World War II structures pass away, with all the contradictions, laments and triumphs found in such a moment. Perhaps it is not surprising that this moment, this video, sprung from an artist of such profound contradictions and contrariness, that even today, Dylan, something originally rooted in Dylan, could evoke so eloquently our time. But neither hard rain  nor the current chilly weather freezing our worldwide headquarters stops us from our international rounds examining bitcoin and China, the great worldwide acid achievement and Europe’s more cost efficient infrastructure. It’s this week’s International Need to Know, providing nutritional substance about the world even as McDonald’s opens near the Vatican

Without further ado, here’s what you need to know:

Capital Controls, Bitcoin and China

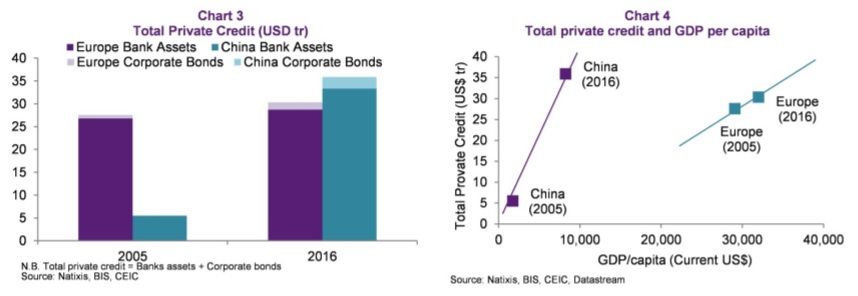
Caesar once claimed all roads led to Rome but today all roads lead out of China, at least for capital, and bitcoin is increasingly becoming an avenue for that capital emigration. Yes, it’s a new year but wealthy Chinese are still working to get their money out of the country. Bitcoin is trading at its highest level in three years at over $1000, increasing by 125% in 2016. China is the largest reason for the increase in value (with a big assist from India and its demonetization). Four years ago China bitcoin usage surpassed the U.S. and the gap is growing as you can see in the chart below. China’s government is instituting new controls on currency exchange which they are pointedly saying are not capital controls. But one person’s currency control is another’s capital control. Even if the government does institute capital controls, with bitcoin and other creative methods available to the wealthy and wise, we put our money on those trying to get theirs out of the country. We can’t verify it, though we can now read it using the much improved Google Translate, but one local Chinese news source claims Chinese buyers are 90% of recent bitcoin volume. We flipped the calendar to a new year but the issue of capital flowing out of China remains.

Acid Levels Down to Pre-Industrialization Levels

Among some there is a doomsday attitude towards climate change, believing that it is unlikely we will curb emissions in time to ward off the worst impacts of climate change. Maybe so, but there are many precedents for humans taking action that made a positive impact on the worldwide environment and we learned of another one while sipping eggnog during the holiday season. Did you know (we certainly didn’t) that acidity levels in the atmosphere are down to preindustrial levels?Science Bulletin informs us that “New research shows that human pollution of the atmosphere with acid is now almost back to the level that it was before the pollution started with industrialisation in the 1930s.” E.U. and U.S. clean air laws deserve much of the credit, according to the article. Acidity pollution peaked in the 1960s and 1970s and has been falling ever since. We are more optimistic than most that climate changes emissions will start falling soon due to technological advances no matter recent acidic electoral events.


Building Europe

When traveling to Europe, we often hear Americans complaining that their infrastructure, especially transit infrastructure, is better than in America. And it probably is. European infrastructure is also less costly to build…by a lot. Over at Vox, Matthew Yglesias notes this fact in talking about how expensive the Second Avenue Subway in New York City is costing to build, clocking in at $2.2 billion per kilometer. By contrast, in Berlin it costs $250 million per kilometer, in Paris $230 million per kilometer and in Copenhagen (one of the world’s most expensive cities), it costs $260 million per kilometer. Yglesias speculates that “paradoxically” the weakness of labor unions contributes to the higher costs of building infrastructure in the U.S. We have heard from others, including in the environmental movement, that Europe’s approach to environmental protection, while every bit as effective as America’s, is more cost efficient. Whatever the reason for being more cost effective, the world could take some pointers from Europe on infrastructure building.   

Mistake Were Made, Health Care Costs and 3 Possibly Related Graphs

Years ago an employee came into our office upset about something we did. They were mid-way through a rant about our screw-up when we politely interrupted them and said they were right, we had made a mistake, and we apologized. No weasel words, no attempting to explain anything away–we flat out said we were wrong and shouldn’t have done it. Our employee was not prepared for our admission of error; in fact they were completely taken aback. And they were also very gratified and quickly became a happy and productive worker and human again. We learned an important lesson: saying you’re sorry when you screw up is not only the right thing to do, it’s highly effective. So, after a year of writing INTN, we pause a moment to point out a few of the mistakes we have made these last 12 months. We do not promise to be error free next year but do pledge to point out our failings should we discover them. It’s this week’s International Need to Know, offering apologies even as celebrities worldwide huddle in fall-out shelters desperately trying to outlast the final few days of 2016.

Without further ado, here’s where we made mistakes, plus world health care costs and three maybe related graphs.

Mistakes Were Made


  • We go down as U.S. oil usage goes up


In one of our earliest posts of the year we postulated that we had reached peak oil usage in the United States and that in a decade we would reach peak oil usage in the world. We stand by this prediction but we should note that oil usage in the U.S. increased last year to 19.4 barrels per day. That is still less oil used than at the peak in 2003 but certainly not a good harbinger of things to come. Numbers are still being crunched for 2016 but oil consumption likely increased again, but probably still not above the 2003 peak (we write with fingers crossed–not an easy thing to do, by the way).

  • Mucking up China’s Middle Class
In February we compared the size of China’s middle class with the U.S.’s. We listed China’s middle class as 109 million strong. But, estimates of this demographic vary widely with some pegging the Middle Kingdom’s middle class at over 300 million and others much smaller. We should have noted these varying estimates. 
  • Tripped Up by the Straddle Bus
In late May, we highlighted China’s straddle bus and used it as an illustration of Chinese innovation. While we still maintain China is more innovative than it is given credit for, we vastly oversold the promise of the straddle bus which alas has faced lots of criticism  and now appears to be gathering lots of dust, unused and lonely like common sense during a presidential election. Indeed it is straddling on the possibility of being a scam.
  • Bad Brexit Predictor 
We will attempt next year to no longer underestimate voters’ ability to make us look like a fool. In June, a week before the Brexit vote, we opined, “But we wonder if this will be similar to the Scotland separation election in 2014, where the polls indicated a toss up, but when it came time to pull the lever, voters found it difficult to vote ‘see ya later'”. In our defense, that sentence was followed by caveats that a week hence Europe might be smaller due to a “yes” vote. Nonetheless, Gallup and Nate Silver appear unconcerned by our entry into the election prediction market.
  

Paying for our Health

Health care is likely to be a hot issue in the United States next year. According to the World Bank, about 11% of U.S. health care funding is out of pocket expenditures, that is, money directly paid by the individual patient. The percentage of U.S. health care spending that is out of pocket is relatively low compared to the rest of the world. Yemen and Sudan have the largest percentage of out of pocket expenditures at 76.4% and 75.5% respectively. Much of Europe is relatively low though many of the countries, including Germany, have a higher out of pocket expenditure than the U.S. China is fairly high at 31%. Here’s to a healthy and happy new year.


Three Graphs to Prepare for 2017

With no comment but rest assured we will discuss these perhaps related graphs sometime next year (one must tease and promo 2017), here are three graphs to contemplate while drinking your glass of champagne and toasting in the new year. May it be healthy, happy, prosperous and full of wisdom.


Following the Military Money, Confusing China & Breaking Bad with Oil

This week, two technological advances caught our bleary, head-cold ridden eyes. First, is a huge advance by Google in translation capability. The company used its A.I. technology to radically improve its translation services. Try it out and you’ll see the translation is remarkably better. In fact, the New York Times reports, “The A.I. system had demonstrated overnight improvements roughly equal to the total gains the old one had accrued over its entire lifetime.” This will be transformative (and mean the loss of more jobs). But, we guess the second technological event we saw in the news got far more attention, and perhaps with good reason. A drone captured video of an orca killing a shark. Not even A.I. can trump sharks, especially one being eaten by a killer whale. Thirty years from now when A.I.’s rule the world, they are likely to spend most of their time on shark videos just as today humans do on cat videos. But neither sharks nor A.I. prevent us from following military spending, continuing to be baffled by China and breaking bad on oil. It’s this week’s International Need to Know, searching the seven seas for all the important international information you need to know.

Without further ado, here’s what you need to know.

Follow the Defense Money

As we have noted before, the world order is in flux with new leaders, Brexit, protests and other events and trends that are shaking up the post World War II global infrastructure. What the new order or chaos will look like it is too soon to tell. One possible trend that could be altered is the amount spent on militaries around the world. Our good friends at the World Bank have documented in the chart below that military spending has been decreasing as a percentage of GDP. In fact, such spending around the world has dropped precipitously since the end of the Cold War with brief increases after 9/11 and strangely enough during the height of the financial crisis. With the U.S. apparently retreating from its global leadership role, will we see a new spike in the coming years? Will countries be able to afford such expenditures? Note the percentage of GDP Saudi Arabia spends on its military in the second chart below and keep it handy when reading the last story of this missive.


Nobody Understands China

The world is atwitter (perhaps appropriate given our tweeting president-elect) about China-U.S. relations. It’s anyone’s guess what the new administration will do and how China will react. But it’s also anyone’s guess what’s going on in China’s economy right now. We are confused ourselves, even more than usual. We continue to see large capital outflows out of China with Goldman Sachs stating that nearly $70 billion exited China in November, well above the previous monthly pace of $50 billion since June. I recently asked a China expert whether wealthy Chinese are taking their money out of China because of political or economic concerns. He smiled and said to me, “there is no difference between politics and the economy in China today.” At the same time, however, the Chinese economy appears to be growing at a robust pace when we look at underlying economic numbers. For example, China’s freight volumes rose 13.9% year over year, up for the fourth straight month. Meanwhile, real estate prices in cities continue to go up, making some Chinese cities home to some of the most expensive real estate in the world. But on the economists’ fourth hand, as Christopher Balding points out, “China’s bond market has suffered its biggest rout in years, with yields on 10-year sovereigns rising from 2.6 percent in October to nearly 3.5 percent after the Fed hiked rates.“ What does all this add up to? We admit we don’t understand China, today perhaps more than ever.  China is like William Goldman’s Hollywood, “No one knows anything.”

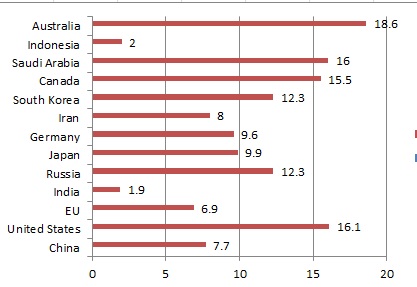
Breaking Bad with Oil

The annual Economic Report of the President came out earlier this week and it is chock full of interesting charts and data and not just those concentrated on the U.S. There’s a helpful chart we show below displaying what price oil needs to be for various oil producing countries to break even. Currently oil is around $55 per barrel. That’s not high enough for most of these countries. They either become more efficient at producing oil, the price of oil rises, or these countries will face continued economic pressure with all the ensuing consequences. As we’ve written before, we will be unsurprised by short term spikes in the price of oil, but because of technological forces (falling cost of solar, advances in storage and more), the price of oil in the mid and long term is fated to be low.


Lead and Terrorism, Energy Infrastructure and Religion and Education

As the end of this year of trials and tribulations draws near, we were called to jury duty this week. It was our first time as a potential juror and our experience suggests that jury duty is a prime target for a cocky start-up to make more efficient. We sat in a room with pretty good Wi-Fi for much of a day until just before closing time our name was called to a jury pool. With 18 of our peers we trudged into the courtroom where the judge and lawyers asked us a series of questions, including how many would be able to participate in the trial if it lasted all week. Because our jury summons indicated it was a one-day duty (misleadingly it turned out), many of the potential jurors in our pool said they had circumstances which made them incapable of serving more than a day (child care issues, business meetings and unable to remain seated that long were all cited–should we have offered the latter a cushy pillow?). So many said they were unavailable that our whole pool was thrown out and the judge announced we would start over the next day. INTN dutifully showed up the next morning but as it turns out, the defendant did not. And since no other trials were ready, we and the rest of our fellow potential jurors were released into the wild. There must be some sort of app that could be designed to make our juror selection system much more efficient. But as we start to learn java script and wonder how we monetize for the legal system, we examine a possible link between lead and terrorism, ponder the need for worldwide energy infrastructure and discover which religions provide the most education. It’s this week’s International Need to Know, blindfolded and holding a scale to all the wonders of our world.

Without further ado, here’s what you need to know.

Get the Lead Out, Lower Terrorism?

In the late 1980s when we lived in Washington, D.C. and it was the murder capital of the country, we were mugged coming out of a Kentucky Fried Chicken and had our two-piece dinner stolen. It’s a long and, believe it or not, funny story that we would be glad to tell you over a few beers. Why was crime so bad then and so much improved now?  Not enough people are aware of the probable role lead in the environment played in the increase in crime in the United States and once lead was cleaned up and leaded gasoline banned, the subsequent drop in crime. Kevin Drum has been the leading journalist on this issue and has documented both the correlation and scientific arguments for the lead crime theory. It has certainly been proven that children’s brains are damaged by exposure to lead. So, the theory goes, when they grow up, they are more likely to commit crimes. This means if lead does affect children’s brains in a way more likely to lead them to commit crimes that there would be an 18 year or so lag for the increase in crime and decrease once lead is out of the environment. So what does this have to do with International Need to Know?  Well, the same patterns of an increase in crime followed by a decrease once lead is removed, especially leaded gasoline, are also found overseas. And, recently Drum on his blog created a map (see below) of when leaded gasoline was phased out of countries in the Middle East. He then predicts that crime will fall in those countries 20 years after the phase out. So, for example, in Egypt leaded gasoline was phased out in 1998, which if the theory is accurate, means crime will start to fall, well, right about now. Drum also speculates that this could lead to a decrease in terrorism from such countries in the coming years. He admits this is speculative but it will be fascinating to watch whether this prediction comes true. We predict if terrorism does decrease, the militaries and intelligence agencies will take credit much the way the police and courts took credit for the reduction in crime, citing “broken window” and other such policies as the heroes. We wonder many policies we enact are based on misinterpretations. In the meantime, I guess we are grateful our cholesterol is at  least slightly lower than it would have been due to D.C’s once high crime levels.

We Need More Energy

As the former head of Exxon prepares to become the new U.S Secretary of State, we stumbled across Exxon’s forecasts for energy usage over the next 24 years. They expect the world to use lots more energy going forward with huge increases in energy usage in transportation, residential, commercial and industrial sectors. From 2014 to 2040, Exxon predicts energy usage worldwide to increase 65%. As we have said before, we expect solar to increasingly have a larger share of energy generation as costs continue to fall and storage issues are finally being solved. But there are two big challenges for solar to become the dominant energy source. One, as we see from Exxon, is that the demand pie grows like an out of control Thanksgiving dinner. Even as solar generates more power, more power will need to be generated. Second, the world needs to build grid infrastructure to accommodate the new sources of power. We referenced recently a Chinese effort to build a super grid and Germany is currently spending 60 billion Euros to rebuild its grid and is expected to spend another 150 billion Euros to continue to expand its electricity distribution networks. But there is far more to do in both developed and developing countries to build new and revamp old electric grids. It is one of the great infrastructure challenges of our time and will require smart political energy to accomplish.

Where you live more important than what you believe

They say never talk politics or religion at Thanksgiving or Christmas dinners (which seems strange for the latter, but never mind). But today we stride unafraid into religion at INTN as we examine a PEW Research Center demographic study on religion and education. The study finds that Hindus have the fewest years of formal education. But, as the study itself points out, that says more about where the majority of Hindus live—India, Nepal and Bangladesh, all developing countries—than about the religion itself. For example, in the U.S., Hindus have a much higher education attainment level than Christians. Jews have the highest educational attainment level, but again most Jews live in the United States and Israel, both highly developed countries. Hindus and Muslims while behind other religions in years of formal education training, are also the religions with the largest increases in years of educational attainment. So, they’re catching up, quickly. The highest educated groups also have the smallest gender gap. So with Jews and Christians, who have the highest average educational attainment level, women trail men by a small level in terms of formal years of education (and for Jews, women do not trail at all).  More of our fortune is determined by geographical circumstance than we may guess.

Italy Parties like its 1984, Date Finnish Women and Move to Singapore, and Africa’s Longest-Serving Leaders

Somehow in our many years on this planet, we have never read John Steinbeck. We recently rectified this situation by reading The Grapes of Wrath. Steinbeck is very different than what we expected: far more gritty, earthy and melancholy. We enjoyed the book and are edified by it. And yet, we are struck both by its short-sightedness and how much it reflects today’s concerns. Steinbeck attacks the business interests who drove the Joads and other small farmers off the land, forcing them to emigrate to California. We, too, have great empathy for the Joads and their kindreds. But we wonder at the apparent naiveté in his attack on 1930s farming changes. Consider this passage: “The tractor had lights shining, for there is no day and night for a tractor and the disks turn the earth in the darkness and they glitter in the daylight. And when a horse stops work and goes into the barn there is a life and a vitality left…”. So apparently the world is better off without tractors? He goes on to ponder the effect on work by humans using machines: “So easy that the wonder goes out of work, so efficient that the wonder goes out of land and the working of it.” From this great temporal distance, it seems silly to expect tenant farmers to continue inefficient farming methods.There is a little Amish in all of us, wanting time to stop  time, but would Oklahoma be better off today with hundreds of thousands of small farmers? We wonder if 70 years from now what passes for humans will chuckle at our concerns of new technology and efficiencies. In the meantime, we wipe our sweaty brow that has never plowed or picked and peer into Italy’s troublesome economy, examine in which countries students score highest and serve witness to the longest serving leaders in Africa. It’s this week’s International Need to Know, farming for golden nuggets of information in the world’s fertile fields.

Without further ado, here’s what you need to know.

Italy parties like its 1984

Eight months ago we diligently turned your attention to Italy and its banking troubles with a disturbing graph and these words: “Take a look at Italy where non-performing loans make up nearly 20% of its banking system’s assets. These loans are also about 20% of Italy’s GDP. All of this in the 8th-largest economy in the world. Yikes is the technical term to use here, I believe.”* We hope you took yikes to heart because the loans are still performing like the Carolina Panthers, which is to say, they aren’t peforming much at all. Prime MInister Renzi’s defeated referendum has apparently made private sector bailouts of the banks nearly impossible so eyes turn to the European Central Bank for such help. Italy’s economy, to use a technical term every bit as precise as “yikes,” is in a shambles. Per capita GDP is lower today in Italy than it was in 1999 (before it joined the Euro). Italy’s production levels are at 1984 levels–that year the Dow closed at 1211, Apple’s first Mac was sold and a Trudeau was prime minister of Canada (okay, not everything’s different). All this is to say that there’s good reason there is political upheaval in Italy and we expect more chaos to come. There are a number of upcoming elections in Europe this year and they likely will all be influenced by the views reflected in the Pew poll graph below.

*We may have been prescient about Italian banks but we’ve made more than one mistake in the last year of writing INTN. In the interest of fairness and transparency, we will report on them in this space before the end of the year

Date Finnish Women, Move to Singapore

As kids prepare for holiday break, the OECD’s latest report on education around the world reveals that Singapore outperforms the globe in educating its children. Annually the OECD conducts its PISA survey “which evaluates the quality, equity and efficiency of school systems.”: They tested over half a million 15-year-olds in 72 countries to see how they perform in science, reading, math and collaborative problem-solving.” The report points out that despite increases in funding per student since 2006, there has not been an improvement in outcomes. In most OECD countries, large number of students–1 in 5–fall short of “baseline proficiency.”  There are a few stars, however: “only in Canada, Estonia, Finland, Hong Kong (China), Japan, Macao (China), Singapore and Viet Nam do at least nine out of ten 15-year-old students master the basics that every student should know before leaving school.” There continue to be gender gaps in all countries save Finland. In Finland, girls are more likely than boys to be top performers in science. We had occasion to meet with and study Finnish schools a few years ago and saw this success first-hand. Other countries have much to learn from their approach.

Africa’s Longest Serving Leaders

INTN can neither confirm nor deny that we received from unknown sources a way of watching the Broadway sensation** Hamilton without flying to New York and spending all our clients’ money on tickets. The show was excellent, certainly much better than our President-elect’s reviews of it. One of our favorite songs in the play is One Last Time, sung by George Washington, a musical version of our first President’s farewell address. The song reminded us of the poll we displayed here earlier in the year showing support for democracy decreasing, especially among millennials. Such support is also low among a certain set of African leaders who have been serving since Italy’s production was still increasing. Below you will see a chart of the longest-serving leaders in Africa. We look amusedly at compliments of how Castro out-lived so many U.S. presidents as if that was an amazing achievement. We’ll take Washington over Castro and these other leaders’ rule any day.

*How did those two words marry over the years? Why are there not MTV sensations? Nobel prize sensations? 7th Avenue sensations? “Sensations” really needs to play the field some more. Lexicon monogamy is bad.

China’s Workforce Conundrum, the World Can’t Use Computers and the World’s Tourist Slogans

We have pondered in this space of how large a role fear plays in what is happening in our world, in our revolt against post-world war institutions, in how we vote and in many other ways. The documentary, Amanda Knox, now playing on Netflix, can be seen as a metaphor for our times. One theme of the movie is our need to act tribally. There is a great scene showing Italians outraged at the acquittal of the American woman, and similarly Seattlites rallying around their city’s own. Another theme of the film is that most powerful of motivators, fear.  At the end of the film, Amanda Knox’s prescient, eerily, evocative words attempt to explain why she spent four years in jail for a crime she did not commit, but her words could just as easily describe the driving force of many of the world’s recent actions: “I think people love monsters. And so when they get the chance, they want to see them. It’s people projecting their fears,” Knox says. “They want the reassurance that they know who the bad people are, and it’s not them. So maybe that’s what it is: We’re all afraid, and fear makes people crazy.” We will continue to delve into fear and our world, but this week we focus on our continuing obsession about demographics,  examine the conundrums of China’s workforce and survey the world’s tourist slogans. It’s this week’s International Need to Know, not looking under every bed for monsters but instead trying to search for heroes in data, facts and figures.

Without further ado, here’s what you need to know.

Our Continuing Obsession

International Need to Know stands behind few in our obsession over demographics which we believe drives more of the world’s ways than is commonly realized. So when we came across a tweet (we are no luddite but we do believe Twitter has ushered in the end of the world—even though, or maybe because, we use it frequently) from Simon Cox stating that although China’s working age population is decreasing, its workforce is not, it was like placing a fine glass of whiskey in front of us–we dare not resist. As we have pointed out, China’s demographics are aging more rapidly than America’s, but that so far has not impacted the size of the workforce. Even though the working age population has decreased since 2013, the number of Chinese working has steadily increased. Why this is the case is an excellent question. Perhaps because the one child policy means there is not the familial support necessary for Chinese to retire? Perhaps because savings are not enough to compensate for a still nascent social safety net? A growing working age population, if it continues, could help China to maintain stronger GDP growth. FYI, It’s overall population is currently projected to peak in 2030 at just over 1.4 billion people.

Who will Run the Computers?

Speaking of workers, the dearth of talent in the ICT field is well known. These companies cannot find enough skilled workers. That’s certainly true here in our neck of the woods where Amazon, Google, Microsoft and others are all fighting for talent. Now comes a study showing just how few people are capable of using computers at all. The OECD tested the computer skills of over 200,000 people across 33 countries (each country had at least 5000 people tested) in the age range of 16 – 65. Participants were asked to perform 14 computer-based tasks. “The tasks ranged in difficulty from very straightforward to somewhat complicated.” The researchers then defined four levels of proficiency based on the tasks the users were able to complete with Level 1 being people who may have troubles figuring out the on/off switch on their computer to Level 3 in which the participants were able to complete a variety of relatively more difficult computer tasks. The OECD noted that 14% of participants were below Level 1, not able to complete the most simple of computer tasks. They also noted that 26% of the participants were unable to use computers at all. International Need to Know was somewhat amazed at this high percentage of people in the 21st Century unable to use a computer. I guess we won’t have to worry about them reading this online newsletter. Only 5- 8% of the population of these countries achieved the highest level of proficiency, Level 3. Singapore and Japan had the highest percent of their population achieving Level 3 with 8%. Canada and Northern Europe each have 7% of their population in the top tier. In the U.S., only 5% of the population is able to achieve the top level. In a world increasingly reliant on computers, we are apparently helpless to use them.

The World’s Tourist Slogans

Via Jason Kottke, we stumbled across a map showing the tourist slogan for every country in the world, or at least for every country with a tourist slogan. Strangely enough, North Korea does not have a tourist slogan. South Korea does though: “Imagine Your Korea.” We hope Kim Jung-Il is not doing that. Russia’s is “Reveal Your Own Russia,” which Russian fake news bloggers have also adopted for America. We particularly like the enthusiasm of Lithuania’s, “See it! Feel it! Love it!” You can never use an exclamation mark enough in a slogan!!! Finland’s is direct, “I wish I was in Finland.” These slogans reveal much about what countries think of themselves, and perhaps others. Scroll and click to find your favorites.


Asia’s Realignment, A Global Super Grid, and Manipulating the Manipulators

In light of recent events perhaps we should not have been surprised to learn that chimpanzees score higher than humans in “working memory, information processing and strategic play.” No, really, you can see the videos here. The Australian PhD in economics and evolutionary biology blogger (now there’s a description) Jason Collins informs us, “If you briefly flash 10 digits on a screen before covering them up, a trained chimp will often better identify the order in which the numbers appeared. Have us play matching pennies, and the chimp can converge on the predicted (Nash equilibrium) result faster than the slow to adapt humans.” This made me feel both better about what has happened recently and at the same time quite fearful of our future. So we go in search of a chimpanzee to consult about the realignment of Asia, understand the quest for a new super electric grid and amusingly observe the manipulation of manipulators.  It’s this week’s International Need to Know, not monkeying around (though perhaps we should be) about the international doings of this evolutionary world.

Without further ado, here’s what you need to know.

The Shifting Sand Pebbles of Asia

In a parenthetical in last week’s “What to Expect Internationally” story, we noted Asia is likely to realign in the coming years given the recent U.S. election. We recall a small dinner we attended in Vietnam three years ago at which a Vietnamese legislator sat across from us. The topic of China arose and the legislator said that Vietnam would align more closely with China than with the U.S. This surprised us somewhat given Vietnam’s long contentious history with China. The legislator explained to me there was no telling how long and reliable the U.S.’s presence in Asia would be, but China would always be there right next door. Given the recent U.S. election, the Vietnamese legislator’s comments that night seem particularly prescient. Japan’s Prime Minister Abe has already said that if TPP is dead (Japan ratified TPP right after Trump’s election) then they will have to turn to China’s efforts to create an Asian trade bloc, the Regional Comprehensive Economic Partnership (RCEP). If the U.S. turns inward, Asia will realign with China being the main axis. Over a long period of time, this was likely to happen anyway, given China’s size and importance. But rather than over decades, it is now likely to occur in a matter of years with all the consequences, good and bad, that entails. This realignment all takes place at a time of slowing global trade, a phenomenon we will dive into more soon.

A Global Grid

Speaking of Asia and alignments, a China-based group, the Global Energy Interconnection Development and Co-operation Organization (GEIDCO) is  entering into agreements with energy companies, utilities and equipment manufacturers in China, South Korea, Russia and Japan to build a super energy grid. The idea is to make it possible to transmit renewable energy great distances, something that is likely to be necessary to take full advantage of the current revolution in solar and wind power. As New Atlas notes, “It’s simple enough; whenever there’s a big power load somewhere, there’s somewhere else in the world where that demand matches up with a generation spike. When it’s noon in the Gobi desert, and solar generation is at its peak, it’s dinner time in the UK and everyone’s boiling kettles.” GEIDCO will begin building a super grid for Asia that eventually would grow to cover the rest of the world. They hope to have the Asia super grid complete by 2030 and the world linked up by 2050, “all while bringing global clean energy generation capacity up to some 90 percent of the global total energy demand.” This is additional evidence of Asia’s realignment but also illustrates that whatever the new U.S. administration does or does not do on clean energy and climate change, technology and other global actors will likely matter more.

Manipulating Manipulators Manipulates US

The incoming Trump Administration continues to claim it will label China a currency manipulator. And manipulate they do, but current evidence, as the chart below shows, indicates China is currently propping up the Yuan, which should make exports from China to the U.S. more expensive not less. Brad Setzer of the Council on Foreign Relations notes, “…If China stopped all management (“e.g. manipulation”) and let the yuan float against the dollar, China’s currency would drop. Possibly precipitously. China’s export machine would get a new boost.” Bloomberg also reports that China is propping up the Yuan, “China’s holdings of U.S. Treasuries declined to the lowest level in four years, as the world’s second-largest economy runs down its reserves to support the yuan.” So the Trump Administration may try to manipulate China to stop manipulating their currency. But, this manipulation of the manipulators could end up boosting China’s exports to the U.S.*. Seems like a very fitting scenario for the strange new world we now inhabit. 


**For the record, we assert that currency values play a much smaller role in trade balances than is commonly believed.     

 *INTN will be taking next Thursday (Thanksgiving) off as we prepare the stuffing, eat pie and generally ignore our world, fascinating as it is, for a day.  We’ll be back on Thursday, December 1 with more of everything you need to know about our crazy, mixed-up Aunt and Uncle at the dinner table world we live in. See you then.